
Looking for a way to leverage Excel to calculate commissions? You are not alone! In spite of the rise of sales commission automation solutions, many organizations prefer old-fashioned commission spreadsheets. In fact, about two-third of businesses still use Excel to calculate commissions!
After all, Excel is a very respectable choice if you only have a few payees. If you are looking for sample Excel commission spreadsheets / templates, click here. Otherwise, keep reading! We’ll show you how you can build your own commission spreadsheet for your business.
Step #1 – Gather Essential Data
Your first step is to gather essential data:
- Data required to calculate commissions
- Additional data you want to show to reps for tracking purposes
Let’s talk about data required to calculate commissions, this includes:
- Who should be paid data – data identifying who to credit / pay
- Ex: deal owner, opportunity owner, etc.
- How much should be paid data – data used to calculate commission amounts
- Ex: revenue, annual contract value (ACV), number of customer conversions, etc.
- When should it be paid data – data used to establish a payment timeline
- Ex: closed date, invoice date, conversion date, etc.
For example, the following minimalist data makes it possible to calculate commissions because it answers all 3 questions:
- Who should be paid – pay each deal’s opportunity owner
- How much should be paid – multiply each deal’s revenue by a lookup into a rate table
- When should it be paid – pay in the month of the deal’s closed date

Note that we have both raw sales data and supporting data (a rate table). Above is the bare minimum required to calculate commissions. This said, it’s probably a good idea to include additional fields for tracking purposes (ex: customer name, product sold, deal ID, etc.). Your reps and sales managers will thank you!
Step #2 – Add Rate Table Lookups
In this first example, we will lookup a rate table using the VLOOKUP() Excel function to convert each rep’s name to a commission rate.
In Excel, enter your sales data and your rate table as shown below. Select your lookup table. Then, in the top left corner, call it “RateTable” and press <Enter>.

Tip: do not select the “Supporting Data” header in blue – only the rows underneath.
Next, add a column called “Commissions” to your sales table, and enter “=VLOOKUP(A3, RateTable, 2, FALSE) * B3″. This formula takes the value in cell A3 (rep “John Doe”), and then finds a match in previously defined “RateTable”.
When calling VLOOKUP(), we pass 2 as a parameter, because it’s the index of the field to load in the rate table (“Rate” is the second field in our rate table). We also specify FALSE to indicate that our rate table is NOT sorted. All we need to do is multiply our lookup value by the revenue from cell B3. This is correct, 5% applies since the rep is “John Doe”, and the amount is $1,013.34 (B3), giving us $50.67.

In this second example, we will use a different commission model. We will lookup a rate table using the LOOKUP() Excel function to convert each deal’s amount to a commission rate.
In Excel, enter your sales data and your rate table as shown below. Select your lookup table. Then, in the top left corner, call it “RateTable2” and press <Enter>.
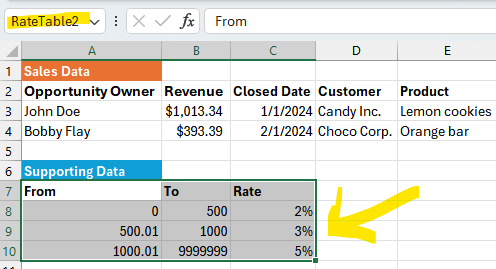
Tip: do not select the “Supporting Data” header in blue – only the rows underneath.
Instead of the VLOOKUP() function, we can use the LOOKUP() function to perform a range lookup. Next, add a column called “Commissions” to your sales table, and enter “=LOOKUP(B3, RateTable2) * B3″. This formula takes the revenue amount from cell B3 ($1,013.34), and then finds a match in previously defined “Rate2Table”.
When calling LOOKUP(), Excel finds the right entry in our range table. All we need to do is multiply our lookup value by the revenue from cell B3. This is correct, 5% applies since the deal amount is $1,013.34 (B3), giving us $50.67.

Step #3 – Add More Complex Lookups
Often, commission structures require commission tiers to be applied based on attainment (ex: total revenue closed in a month). There are two variants of this scheme (choose one here):
- Non-cumulative tiers. Only the highest attained tier matters. All the deals are paid based on the highest attained tier (at the same rate).
- Cumulative tiers. Tiers are progressive (like tax brackets). Each deal is paid at the rate corresponding to the tier. Some deals may be paid at a lower rate, and others at a higher rate.
First, let’s consider non-cumulative tiers. First, we need to sum revenue across deals. Here is the sum across all deals for rep “John Doe”:

Next, we can use the sum to LOOKUP() into our attainment rate table, and multiply the revenue of each row by this rate:

Things are a bit more complicated if tiers are cumulative. One solution is to add a column which calculates cumulative revenue using the SUM() function for rows “above”:
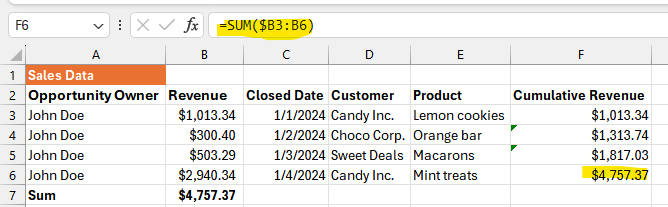
Next, we can use the cumulative revenue of each row to LOOKUP() into our rate table with tiers, and multiply the revenue of each row by this rate:

Above, we can see that the rate starts at 3%, but advances to 5% on the last deal based on cumulative revenue.
Now, there is a small flaw in this approach. The first row has a cumulative revenue of $1,013.34. This means we reached the $1000-$3000 range in terms of attainment. Therefore, we blindly apply the second tier’s rate of 3%. The flaw is that 3% is applied to the entire deal’s amount of $1,013.34!
However, you may want to pay a blended rate on this deal’s amount. A portion of the deal should be paid at the 2% rate (the portion from 0 to $1,000) and another portion of the deal should be paid at the 3% rate (the portion from $1,000 to $1,013.34). This gives us a different commission value of 2% * $1000 + 3% * ($1,013.34 – $1000) = $20.40 instead of $30.40 on this deal!
You may ignore this problem and it won’t make a big difference if deal amounts are small. Otherwise, to do this correctly, you need a much more complicated Excel formula. To illustrate why, consider this blog post discussing Excel formulas for tax brackets with cumulative tiers. At this stage, you enter “Excel hell” and we’d highly recommend using our free tiered commission calculation tool or using a proper commission management solution! We promise, we will easily take care of this problem for you.

Step #4 – Add Bonuses
You can easily add bonuses based on total attainment using the following:
- Sum revenue (or the number of appointment scheduled, deals closed, etc.)
- Use the sum to LOOKUP() a table, converting the sum into a bonus amount

Step #5 – Manage & Distribute Spreadsheets
Congratulations, your spreadsheet is working well. Now, you have to do the following:
- Divide your master sales spreadsheet into 1 spreadsheet per rep
- Ex: one spreadsheet is for “John Doe” which only list sales for this rep
- Ex: one spreadsheet is for “Bobby Flay” which only list sales for this rep
- Password-protect each spreadsheet (since the data is confidential)
- Make a backup of each spreadsheet (in case you have a commission audit)
- Distribute each spreadsheet to the correct rep and manager (double-check before sharing)
- Manage back-and-forth, disputes, data corrections, etc.
Step #6 – Verify Spreadsheets
There may be some back-and-forth / disputes with reps after you distribute commission spreadsheets. We highly recommend the following:
- When receiving an edited spreadsheet, make sure there are no hidden or invisible (white text) rows. Such techniques can be used to tamper with the calculated total payout.
- Make sure rates and lookup tables remain unaltered. Double-check all formulas to make sure there was no alteration.
We’re not saying this is easy to do, but there is no way around this using Excel.
Problem – Excel Does Not Scale!
Thank you for reading so far!
You can see that the process of calculating commissions with Excel can be overwhelming and remains very manual (since you need to split one master spreadsheet into several ones). Excel also does not work well when you want to perform more complex calculations, such those with cumulative tiers. It’s also very difficult to avoid tampering with formulas or rates when disputes occur.
Here are some fundamental problems with Excel commission spreadsheets:
- You have to manually export sales data from your CRM or accounting system
- You have to manually split sales data and generate one spreadsheet per rep
- It’s a headache to manually archive, distribute, and revise spreadsheets
- Excel formulas won’t make sense to most reps and reduce transparency
- It’s easy to tamper with commission spreadsheets
- There is no statement / formula version control, audit log, or traceability
- It’s not possible to enroll users in incentive plans (ex: e-signature)
- There is no process for managers to approve commission statements
- Complex commission schemes require MANY Excel formulas and intermediary calculated columns
- Managers don’t have a unified view of commissions / attainment across team members
- It’s hard to visualize commission trends across reps, teams, etc.
- You cannot easily create commission reports spanning multiple spreadsheets
Finally, Excel does not offer native commission capabilities to handle typical commission scenarios such as clawbacks, quotas, draws, manual adjustments, etc.
Sales Cookie can handle the most complex commission schemes and streamline all commission related sales operations. For example, calculating commissions using a cumulative tier model is very painful using Excel, but very basic for us. Because of our foundation, we can automate 99% of commission schemes. We’d love to help!

Questions
How can I calculate commissions for multiple reps?
You can split your master Excel commission spreadsheet into individual spreadsheets (one per rep). Or better, you can automate commission calculations for multiple reps using commission automation software such as Sales Cookie. You can design your compensation logic using Sales Cookie’s plan builder, assign plans to reps, sync CRM or accounting data, and calculate commissions in parallel for each rep.
How can I calculate commission rates when tiers are cumulative?
Excel makes it hard to calculate blended rates for deals which cross tiers (ex: a deal worth $1,013.34 must have a portion paid at the 2% rate, and another portion paid at the 3% rate). It’s possible to do it, but the required Excel formulas are fragile and hard to maintain. If your commission scheme requires this, we highly recommend using an automated commission solution.
Can you elaborate on challenges with Excel-based commissions?
Absolutely, please refer to this video or this blog post.
Can you provide sample Excel commission templates for different scenarios?
Yes, please refer to this blog post. Again, Excel will only go this far and the process remains manual.
Should I Use Excel or A Commission Automation Solution?
The best way to answer your question is to measure your own ROI. How much time do you spend managing commissions? Are you reps leaving over commission issues? If you have more than 8 reps, you probably should consider automation. To check if you are ready to automate your commissions, use this assessment page, or watch this video.
What if I need to calculate commissions every day?
Using the power of automation, it becomes possible to calculate commissions real-time. All commissions statements are available anytime, from any device to you, your reps, and your managers.
