
Updated for 2026 · 14-minute read · Written by the team at Sales Cookie
If you are designing — or auditing — a sales compensation plan in 2026, the first question you have to answer is also the hardest one: what is a fair commission rate for the kind of selling we actually do? Pay too little and your top reps walk to a competitor. Pay too much and your unit economics quietly bleed out one quarter at a time.
This guide is built to make that question answerable in an afternoon. We pulled together 2026 commission benchmarks across ten major industries, mapped them against the most common pay-mix and structure choices, and then translated everything into a decision framework you can actually use. Where rates vary by sub-segment (residential vs. commercial real estate, term vs. whole life, SMB vs. enterprise SaaS), we break the numbers out instead of hiding them behind a single average.
TL;DR — the 60-second version
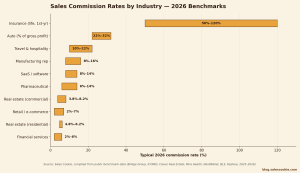
- Across most B2B and consumer industries, commission rates in 2026 fall between 5% and 20% of sale value, but the “true” range stretches from under 2% in mass retail to 50%+ of first-year premium in life insurance.
- SaaS new-logo commissions sit around 10–14% of Annual Contract Value (ACV); renewals pay 4–5%.
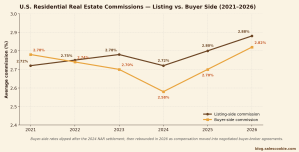
- The U.S. residential real estate average is now 5.70% combined (≈2.88% listing / ≈2.82% buyer side) after the post-NAR-settlement reset.
- The biggest 2026 shift is structural, not numerical: two-thirds of comp teams are moving toward pay-for-performance with steeper accelerators above 100% and explicit decelerators below 50–60%.
- Plan complexity is now the #1 commission risk. Companies still calculating in spreadsheets typically lose 3–5% of payouts to errors — that’s six figures a year at modest scale.
How a “commission rate” is actually defined (and why it matters)
A sales commission is the variable, performance-contingent slice of compensation paid to a seller for closing or contributing to a sale. Most articles stop there, which is exactly why so many comp plans go sideways. The number “10%” can mean five different things depending on what it is multiplied against:
- % of revenue — the simplest model, common in SaaS and services.
- % of gross profit — standard in auto, distribution, and configurable-product sales.
- % of first-year premium — the dominant model in life and health insurance.
- % of contract value (ACV/TCV) — the SaaS standard, often paid up-front but sometimes split across the contract term.
- Flat fee per unit — used in retail, low-cost subscriptions, and some auto plans (“mini” commissions of $100–$200 per car).
Always nail down the denominator before you negotiate the percentage. A 10% rate on revenue and a 10% rate on gross margin are completely different jobs. For a deeper look at the underlying calculation pipeline — filter, valuate, credit, attain, payout — see our companion piece on deconstructing sales commission software.
What drives commission rates up or down in 2026
Commission rates do not appear out of thin air. Five forces, in roughly this order of magnitude, set the rate for any given role:
- Gross margin per deal. The single biggest driver. A 50% margin product can pay 15% commission and still print money; a 6% margin product cannot.
- Sales-cycle length and complexity. Long, multi-stakeholder cycles justify higher rates because reps wait longer for payouts and absorb more risk per opportunity.
- Lead source and pipeline ownership. When the company hands the rep an SQL, the rate is usually 30–40% lower than when the rep self-sources the deal.
- Recurring vs. one-time revenue. Subscription products typically pay lower up-front rates because lifetime value compensates over time. Renewal commissions of 3–5% are now the norm.
- Talent market. A median Bay Area enterprise AE costs 15–25% more in OTE than the same role in Charlotte. Geography still matters, even with remote work.
Two secondary drivers — regulation (especially in insurance and Medicare) and the buyer’s expectation of price transparency (especially in real estate) — can move rates by several points within a single calendar year. Both are doing exactly that in 2026.
2026 commission rates by industry
The benchmarks below come from public 2025–2026 data published by Bridge Group, ICONIQ, Clever Real Estate, NerdWallet, the U.S. Bureau of Labor Statistics, RepVue, Mira Health, and several practitioner surveys. Where sources disagree, we report the consensus range rather than a single point estimate.
SaaS and software
For B2B SaaS Account Executives, the median commission rate at 100% quota lands at 11.5% of ACV, with most plans falling in the 8–14% range. The sub-segment matters more than the headline:
| Segment | Typical commission rate | Typical AE OTE (2026) |
|---|---|---|
| SMB AE (under $50K ACV) | 10–15% | $110K–$145K |
| Mid-market AE ($50K–$250K ACV) | 8–12% | $160K–$205K |
| Enterprise AE ($250K+ ACV) | 5–8% | $235K–$325K |
| Renewal / customer success | 3–5% of renewal ACV | $130K–$185K |
Quota-to-OTE ratios in 2026 cluster around 4×–6× for SMB and mid-market reps and 5×–8× at later-stage enterprise companies. Accelerators above 100% attainment are now standard — most plans add 1.4×–2× on revenue past quota — and around four out of five comp teams are tightening their decelerator floor for reps below ~60% attainment. If you want to model these tier transitions cleanly, our tiered commission calculator handles blended rates across boundaries.
Real estate
The post-2024 NAR settlement era has measurably reshaped agent compensation. The 2026 U.S. residential commission averages roughly 5.7% combined, split ~2.88% to the listing agent and ~2.82% to the buyer’s agent — but with much more local variation than before. Commercial deals still pay 4–8%, sliding lower as deal size grows.
State-level dispersion is now the headline story: averages range from roughly 4.85% in Washington to over 6.10% in Oklahoma. In rentals, agents typically charge either one month’s rent or a flat 8–15% of one year of rent, depending on metro convention.
Insurance
Insurance pays the highest first-year rates in any industry — and the most aggressive renewal trail. The 2026 picture by line of business:
| Line of business | First-year commission | Renewals |
|---|---|---|
| Term life | 50–80% of premium | 2–5% |
| Whole life | 70–110% of premium | 2–5% |
| Personal auto (P&C) | 10–15% | 10–12% |
| Commercial P&C | 10–15% | 10–13% |
| Health (group / individual) | 3–7% of premium | 3–6% |
| Annuities | 2–8% of premium | 0.25–1% trail |
| Medicare Advantage (national, 2026) | $694 / member (initial) | $347 / member (renewal) |
Captive agents typically receive a base salary or draw and lower percentage rates (8–12% on personal lines), while independents push 12–15% on new business and 10–12% on renewals. The Medicare Advantage broker compensation cap rose roughly 11% year-over-year for 2026 per CMS — one of the largest single-year jumps on record.
Automotive
Auto sales remain a gross-profit business, not a revenue business. Commissions in 2026 sit at 22%–32% of dealership gross profit per vehicle, with 25% being the most common pay-plan number. “Mini” commissions of $100–$200 per car kick in when a deal sells at or below cost.
Annual income at U.S. dealerships clusters in three bands per BLS occupational data: $35K–$45K for entry-level reps, $50K–$80K for mid-tenure, and $100K+ for high-volume top performers. A growing share of dealerships have moved to a base salary plus commission model in 2026 to stabilize CRM hygiene and CSI scores.
Pharmaceutical and medical device
Pharma and med-device reps still skew toward base-heavy plans (typical pay mix of 70/30 or 60/40) because of long product education cycles and regulatory scrutiny. Effective commission rates land at 6–14% when monetized as a percentage of territory revenue, but most plans reward MBO-style scorecards rather than per-unit commission.
U.S. base salary ranges in 2026: territory reps $60K–$140K base, key account managers $85K–$125K base, medical science liaisons $111K–$196K. Tiered commission tables (e.g., 5% to quota, 7% from 100–120%, 10% above 120%) are standard. Specialty oncology and rare-disease territories pay materially higher than primary care.
Travel and hospitality
Travel agent commissions in 2026 sit in a wide 10%–22% range, but the supplier mix matters more than the average:
- Cruises: 10–16% of commissionable fare; volume-based tiers can lift this to 18%.
- Hotels: 10–15% retail; 15–20% for consortia partners; 20–35% effective margin via wholesale net rates.
- Tour operators & packages: 12–18% standard, 25–40% on private and custom itineraries.
- Airlines: 0–2% (legacy carriers may pay 1–2% with 2–4% backend).
Host agencies most often split commissions 70/30 or 80/20 in favor of the agent, with 90/10 reserved for high-volume independents.
Financial services
Financial advisor compensation has continued its slow march away from product commissions and toward AUM and flat-fee models. The 2026 landscape:
- AUM fees: 0.50%–1.50% per year, with 1% the rough median below $1M and 0.50%–0.75% above $5M.
- Mutual fund sales loads: 1%–6% one-time (front- or back-end); trailing 12b-1 fees of 0.25%–1% per year.
- Annuity commissions: 2–6% of premium for fixed annuities, 5–7% for variable, with surrender-period trade-offs.
- Insurance-linked products: follow the insurance schedule above.
Effective commission rates for product-pushing roles fall in the 2%–6% band, lower than most industries, balanced by relationship economics that compound over years rather than quarters.
Manufacturing and industrial sales
For independent manufacturers’ representatives, the 2026 average is roughly 8–16% of net sales, with 10–12% typical for high-volume electromechanical and electronics lines and rates pushing into the high teens for niche capital equipment. In-house manufacturing reps tend to earn 5–10% on a base-plus-commission plan because the company absorbs marketing and product-management costs.
Retail and e-commerce
Retail commission rates remain the lowest of any major sector at 2%–7%, layered on top of an hourly wage in most stores. High-ticket categories — appliances, electronics, jewelry, designer apparel — lift the average toward the upper end of that band. Per-unit “spiff” payments (e.g., $25 per protection plan attached) are increasingly common in 2026 as retailers chase margin instead of just volume.
Pay-mix benchmarks: how much should be variable?
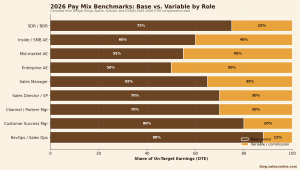
Industry rate is one half of the equation. The other half is pay mix — how much of OTE is fixed base salary versus variable commission. The 2026 benchmark by role:
- SDR / BDR: 70/30 to 80/20. Variable is paid on meetings booked or SQLs accepted, not closed revenue.
- Account Executive: 50/50 to 60/40. Closer to 50/50 in transactional cycles, closer to 60/40 in long enterprise cycles where pipeline lag would otherwise punish reps.
- Sales Manager: 60/40 to 70/30. Variable pay is largely team performance, with a smaller MBO component.
- Channel / Partner Manager: 70/30 typical; partner-sourced revenue is harder for the rep to fully control.
- Customer Success Manager: 80/20, weighted toward retention metrics and net revenue retention.
- RevOps / Sales Ops: 85/15 to 90/10, tied to global company metrics.
Which commission structure should you actually choose?
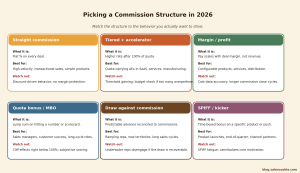
Across the hundreds of plans we automate at Sales Cookie, six structures cover the vast majority of real-world deployments. Match the structure to the behavior you want, not to the org chart.
- Straight commission — Flat percentage on every closed deal. Best for high-velocity, transactional sales with simple products. Watch out for discount-driven behavior; reps will trade margin for volume.
- Tiered commission with accelerators — A higher rate kicks in past 100% of quota (typically 1.4×–2× the base rate). Now the dominant SaaS structure. Keep tier counts to two or three; more than that becomes unintelligible.
- Margin- or profit-based commission — Pay scales with deal margin, not revenue. Strongly recommended for configurable products and services. Requires clean cost data and slightly slower commission close cycles.
- Quota-based bonus / MBO — Lump sum paid at scorecard thresholds (often 80%, 100%, 120%). Common for managers and customer-success roles where per-deal commissions create the wrong behavior.
- Draw against commission — A predictable advance that reconciles to actual commissions earned. Useful during ramp; dangerous as a long-term structure if it becomes “non-recoverable” without guardrails.
- SPIFFs and kickers — Time-boxed bonuses tied to a product, segment, or campaign. Powerful for product launches and end-of-quarter pushes, but the moment SPIFFs run constantly they stop feeling special. Treat them as seasoning, not the entrée.
Five questions to actually pick a plan
Generic frameworks tend to read like “align with goals, communicate clearly.” Useful sentiment, useless decision tool. Here are five questions that genuinely narrow the field:
- Who controls the outcome? If the answer is “one rep,” choose an individual plan. If it’s “a pod” or “the company,” run a group plan. Don’t pretend one plan covers both.
- How long is the behavior horizon? Monthly cycles call for commissions and SPIFFs. Multi-year strategic bets call for LTIPs, equity, or deferred bonuses.
- Can the metric be measured cleanly within five business days of period close? If not, reps will lose trust and start “shadow accounting.”
- What is the worst-case payout if everyone wins? Run the numbers at 120%, 150%, and 200% attainment. If those scenarios bankrupt the plan, add caps or move to a bonus pool.
- Could a rep explain the plan to their spouse in two sentences? If not, simplify. The 2026 best-practice trend is three core metrics, not five or six.
Frequently asked questions
What is a typical sales commission rate in 2026?
Most industries fall between 5% and 20% of sale value, with SaaS averaging roughly 10–14% of ACV, B2B services 8–15%, retail 2–7%, and insurance 50%+ of first-year premium for life lines.
Which industry pays the highest commission rate?
First-year life insurance, by a wide margin (50–120% of premium), followed by independent insurance brokerage (12–15%), commercial real estate (4–8% on much larger absolute deal sizes), and enterprise SaaS (8–12% with strong accelerators).
What is a “good” commission percentage of total compensation?
For quota-carrying AEs, 40–50% of OTE as variable is the 2026 norm. SDRs sit closer to 20–30%. Sales managers typically run at 30–40%. Anything below 20% no longer drives meaningful incentive behavior; anything above 60% only works in pure-commission cultures with strong base-line lead flow.
Is a 20% commission rate normal?
Yes — but only in specific contexts. Auto reps earn 22–32% of gross profit, not revenue; high-margin SaaS can pay 15–20% on accelerated revenue above quota; commercial real estate can clear 20%+ after splits on smaller commercial deals. On revenue, 20% across the board is rarely sustainable outside life insurance and high-margin services.
What is the typical commission rate for B2B sales?
B2B sales commission rates in 2026 cluster at 5–15% of deal value, with SaaS, professional services, and complex industrial sales pushing toward the upper end and accelerators reaching 18–22% on revenue past quota.
What are the three most common commission structures?
Straight commission (flat % on every deal), base-plus-commission (the dominant B2B model), and tiered commission with accelerators (higher rates above quota). Almost every modern plan is a flavor of these three, often combined with a small SPIFF or MBO overlay.
How often should commission rates be reviewed?
The 2026 best practice is quarterly tuning of mechanics (rates, thresholds, accelerators) and an annual structural review. Big-bang January rewrites concentrate risk and tend to break trust mid-cycle.
From benchmarks to a plan that actually pays right
Knowing the right commission rate is necessary but not sufficient. The harder problem is calculating it correctly, every period, for every rep, across every plan exception. Companies still running on spreadsheets typically lose 3–5% of total payouts to errors — overpayments that rarely get clawed back, plus the silent tax of disputes that pulls reps out of selling and into “shadow accounting.”
That is the gap Sales Cookie closes. We process billions of dollars in commission payouts for companies ranging from Fortune 500 to small retailers, with full automation across:
- End-to-end calculation across every rep in a single click, with tier blending, splits, and clawbacks handled natively.
- Time-dependent variables for quotas, rates, and territories so mid-period role changes don’t break the math.
- Per-rep online statements with audit trails — replacing the “email-the-spreadsheet” ritual that erodes trust.
- Direct integrations with Salesforce, HubSpot, QuickBooks Online, Xero, and other systems, plus webhook and Zapier connectivity.
- A documented plan-design methodology, captured in The Ultimate Guide to Sales Commission Design and our growing help portal.
Whether you are dialing in a 12% SaaS rate, navigating the post-settlement real estate environment, or building your first tiered plan for a hybrid sales team, the math should be the smallest part of the conversation. Start a free trial — or browse the rest of Sales Commissions Explained for deeper dives on plan design, accelerators, ramped quotas, and ASC 606 compliance.
Sources consulted (non-exhaustive): U.S. Bureau of Labor Statistics OES data; Bridge Group 2024–2025 SaaS AE Compensation Reports; ICONIQ 2025 GTM Compensation & Incentives Guide; Clever Real Estate 2026 Agent Survey; Mira Health Insurance Commission Survey; NerdWallet Financial Advisor Cost Guide 2026; CMS broker compensation notices; RepVue Cloud Sales Index Q4 2024–Q4 2025; Wikipedia entries for commission (remuneration) and on-target earnings. Where benchmarks varied across sources, Sales Cookie reports the consensus 2026 range.
