
Reading time: about 12 minutes. Audience: VPs of Sales, Sales Ops leaders, CFOs, and HR partners who own retention.
Every Sales Ops leader has lived this moment. A top performer schedules a 1-on-1, closes the door, and quietly says some version of, “I don’t trust the numbers anymore.” Two weeks later they’re at a competitor, taking pipeline relationships with them. The exit interview points at compensation. The actual root cause, more often than not, is a commission process that nobody fully trusts.
The cost is enormous, and it is almost entirely preventable. This guide walks through the real numbers behind rep churn, the dispute patterns that drive resignations, and how an AI-powered commission engine like Sales Cookie closes the gaps before they cost you a quota carrier.
The trillion-dollar retention problem nobody talks about
Gallup put a price tag on voluntary turnover in U.S. business: $1 trillion every year. Replacing a single employee runs between one half and two times their annual salary, and that band gets wider for revenue-generating roles. For a quota-carrying B2B sales rep, the DePaul University Center for Sales Leadership documented a fully loaded replacement cost between $114,957 and $150,000 once you include recruiting, onboarding, training, and lost sales in the open territory.
Time-to-fill is the line item finance leaders tend to underestimate. DePaul measured an average of 6.2 months to fully replace a B2B sales rep, with a range of 5.8 to 7.8 months depending on industry. The Society for Human Resource Management found average cost-per-hire of $4,700, but stresses that recruiters they surveyed believe true total cost ranges from three to four times the position’s salary once productivity ramp is included.
For sales specifically, the churn picture is grim. HubSpot’s State of Sales data shows average B2B sales rep tenure has compressed to roughly 18 months. The Bridge Group’s annual SaaS sales benchmarks consistently report annual rep turnover around 35 percent, with voluntary departures making up the larger share.
Compensation issues are the trigger, not the cause
When you read exit interview summaries side by side, a pattern emerges. Reps rarely cite “the commission rate was too low.” They cite trust. The Aberdeen Group found that 25 to 50 percent of a sales rep’s monthly time can be consumed by shadow accounting, the practice of building a private spreadsheet to verify what the commission system says they earned. WorldatWork has documented that 22 percent of sales reps file at least one commission dispute per year, and 9 percent of voluntary resignations in sales roles trace to compensation transparency issues.
Stack those numbers next to Salesforce’s 2024 State of Sales: 84 percent of reps missed quota in the prior year, 67 percent did not expect to hit it in the current year, and reps reported spending 70 percent of their workweek on non-selling tasks. When a rep is already under attainment pressure and finds an error on their statement, the fastest win is often a new offer letter from a competitor.
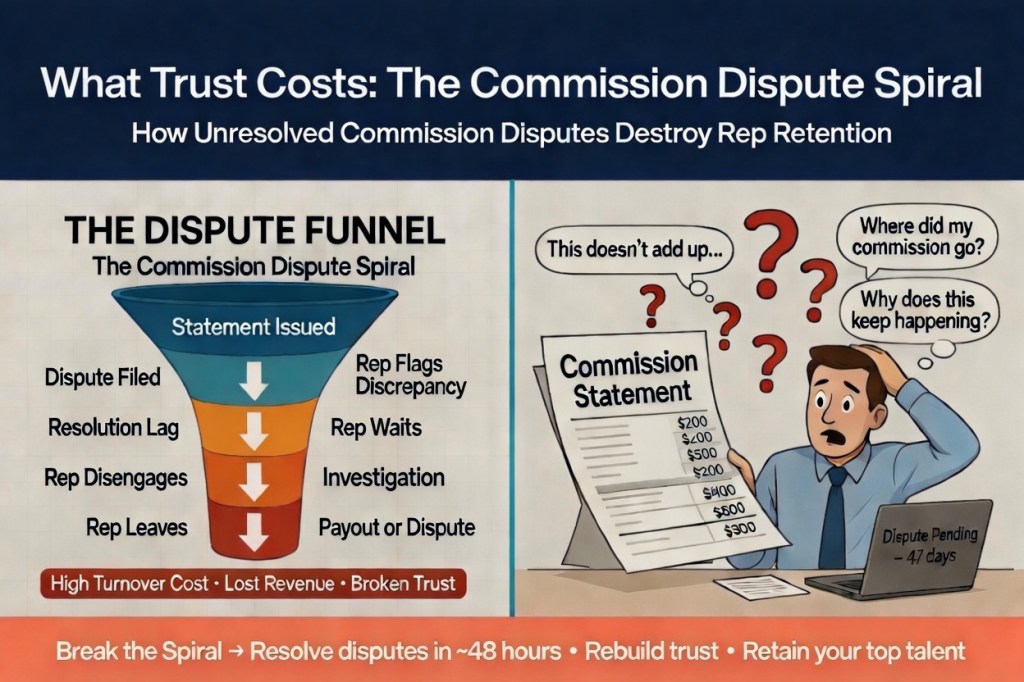
Where commission disputes actually come from
Across customer interviews and post-mortems, disputes cluster into a small number of categories. Knowing the categories matters because each one has a different fix.
| Dispute category | Typical root cause | % of disputes | Fix |
|---|---|---|---|
| Wrong deal credited to wrong rep | Stale CRM ownership, territory transitions | ~28% | Effective-dated territory rules |
| Quota or accelerator applied incorrectly | Manual tier lookups, formula errors | ~22% | Rule-based plan engine |
| Missing or duplicate deals | CRM-to-spreadsheet copy errors | ~18% | Direct CRM sync, dedupe checks |
| Split confusion (AE/SDR/SE/partner) | Undocumented or conflicting splits | ~14% | Documented split rules with approvals |
| Clawback or refund processed late | No mechanism to reverse paid commission | ~10% | Automated clawback workflow |
| Plan ambiguity (rep reads plan differently) | Plain-English gaps in plan documents | ~8% | Plan simulator and signed acknowledgement |
Estimates compiled from Aberdeen Group sales operations benchmarks and WorldatWork sales compensation surveys.
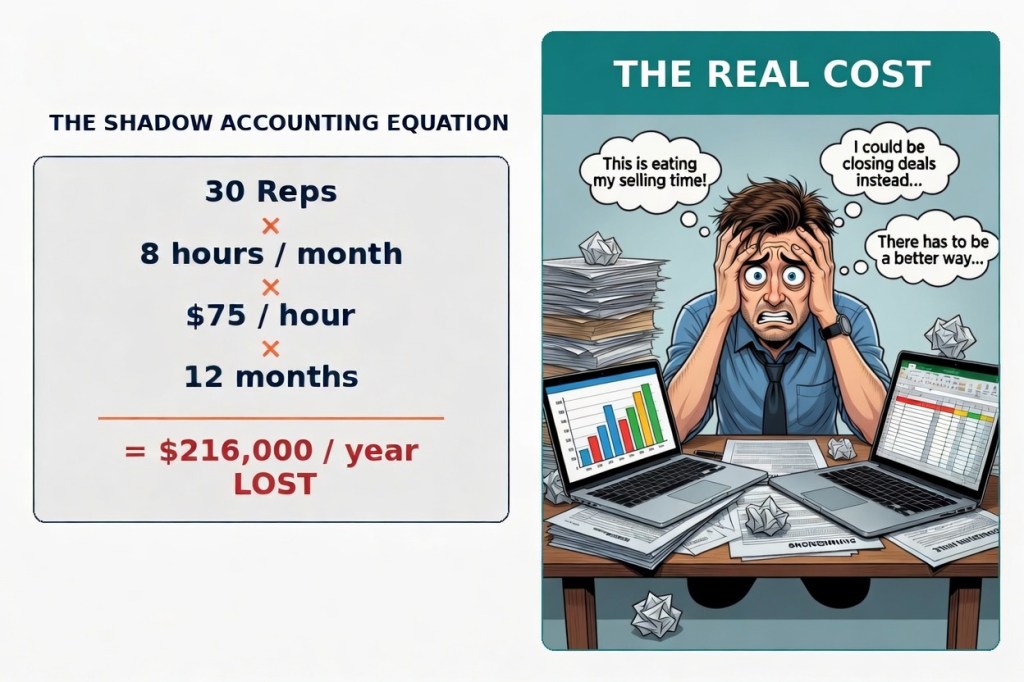
The hidden tax: shadow accounting
Shadow accounting is the most expensive thing nobody on the leadership team sees. A rep who does not trust commission statements builds their own spreadsheet, checks every payout against it, and burns hours every month doing the company’s job. Multiply that across a 30-rep sales floor and the lost selling time runs into the millions of dollars per year.
How AI changes the dispute math
The traditional answer to commission disputes was hire more analysts. The modern answer is to remove the conditions that produce disputes in the first place. McKinsey’s research on AI in finance and operations found that 42 percent of finance activities are fully automatable with current technology, with generative AI saving an additional 20 to 30 percent of finance team time on top of legacy automation. Salesforce’s 2024 State of Sales reports that 81 percent of sales teams are now experimenting with or actively using AI, and that 83 percent of teams using AI saw revenue growth versus 66 percent of teams without it.
For commission specifically, AI does three things spreadsheets cannot do at all.
- Anomaly detection. The system flags statements that fall outside normal patterns for a rep, such as a sudden 40 percent drop or a quota credit that exceeds an account’s contract value. The flag fires before the statement is sent, not after the rep complains.
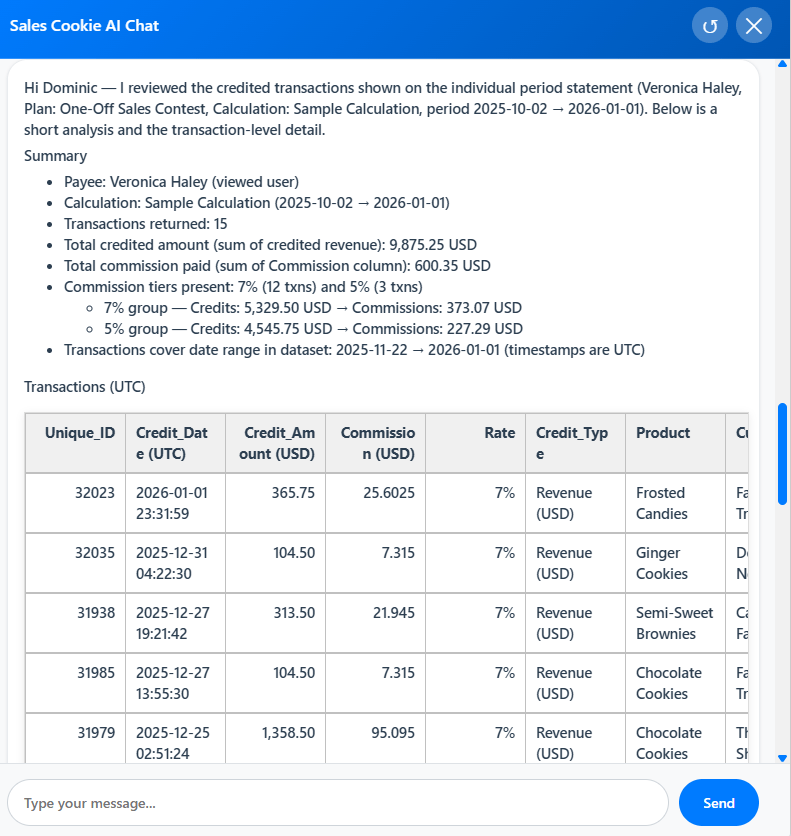
- Natural-language plan reasoning. A rep can ask, “Why did I earn $4,210 on the Crestline deal?” and get a plain-English breakdown of every rule that touched the calculation, with the source data linked.
- Predictive dispute risk scoring. Based on historical patterns, the engine scores which statements are most likely to generate a dispute and pushes those to a reviewer first.
What good looks like: dispute KPIs to track
| Metric | Manual baseline | Automated + AI |
|---|---|---|
| Disputes per 100 statements | 8 to 14 | 1 to 3 |
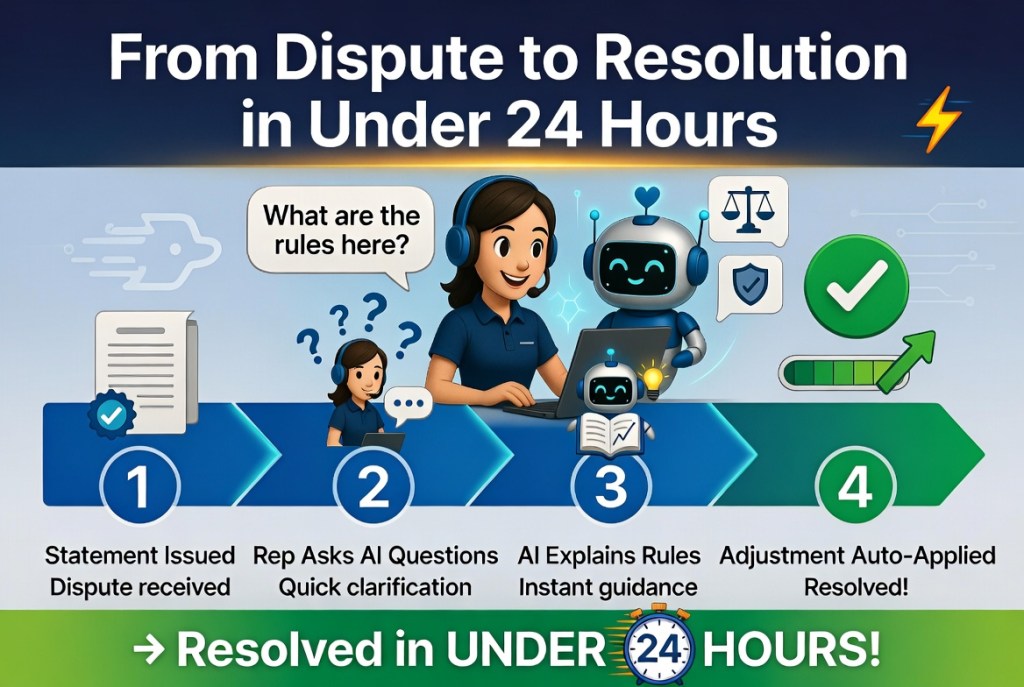
| Average dispute resolution time | 5 to 12 business days | Under 2 business days |
| Statement issuance lag (period close) | 10 to 20 business days | 1 to 3 business days |
| Hours of shadow accounting per rep / month | 6 to 10 | Under 1 |
| Sales ops FTE per 100 reps | 1.5 to 2.5 | 0.5 to 1.0 |
The retention math, written out
Take a 30-rep B2B sales team with 35 percent annual turnover. That is 10.5 reps lost per year. If commission disputes drive even one in five departures, that is two preventable resignations. At a fully loaded $130,000 replacement cost, the company is leaving $260,000 on the table every year just from commission-driven attrition. That is before you count the open-territory pipeline gap or the morale hit on the reps who stay.
The math reverses quickly when statements are accurate, transparent, and on time. Trust compounds the way mistrust does, in the other direction.
What to do this quarter
- Measure your dispute rate. Pull the last six months of statements and count the disputes. If you do not know the number, that is the number.
- Survey shadow accounting. Ask reps anonymously how many hours they spend each month verifying their own pay. Multiply by their fully loaded cost.
- Audit your three highest-value plans. Have someone outside Sales Ops read the plan documents cold and try to compute a sample statement. If they cannot, your reps cannot either.
- Replace the spreadsheet pipeline. Move credit assignment, calculation, and statement delivery into a system of record with full audit history. Sales Cookie handles this end to end and integrates directly with the CRM and accounting systems you already use.
- Publish a transparency SLA. Commit to statement delivery within X business days of period close and dispute resolution within Y. Reps trust commitments they can verify.
Bottom line
Reps don’t quit over a percentage point. They quit when they no longer believe the company can pay them what they earned, on time, without a fight. Fixing that is no longer a moonshot. The technology exists, the playbook is documented, and the ROI is visible inside two quarters. The team you keep this year is the one that hits next year’s number.
Want to see what dispute-free commissions look like in your environment? Book a Sales Cookie demo or read more on our blog.
Sources: Gallup, This Fixable Problem Costs U.S. Businesses $1 Trillion (2019); SHRM Cost-Per-Hire Benchmarking; Salesforce State of Sales 2024; McKinsey, The State of AI (2024); HubSpot Sales Statistics; DePaul University Center for Sales Leadership; WorldatWork sales compensation research; Aberdeen Group sales operations benchmarks.
