Reading time: about 16 minutes. The complete reference for nine sales commission structures with formulas, examples, and a decision framework. Best for Sales Ops leaders, RevOps, and CFOs designing or redesigning a comp plan.
Most commission plans fail not because of the rate, but because of the structure. The wrong structure pays the wrong behavior. The right one aligns rep effort with company outcomes and survives the next product change, the next territory shift, and the next refund.
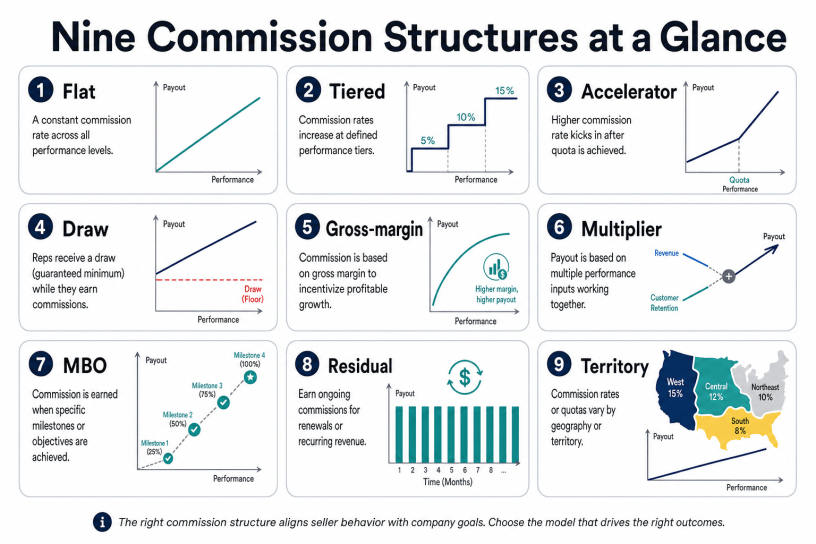
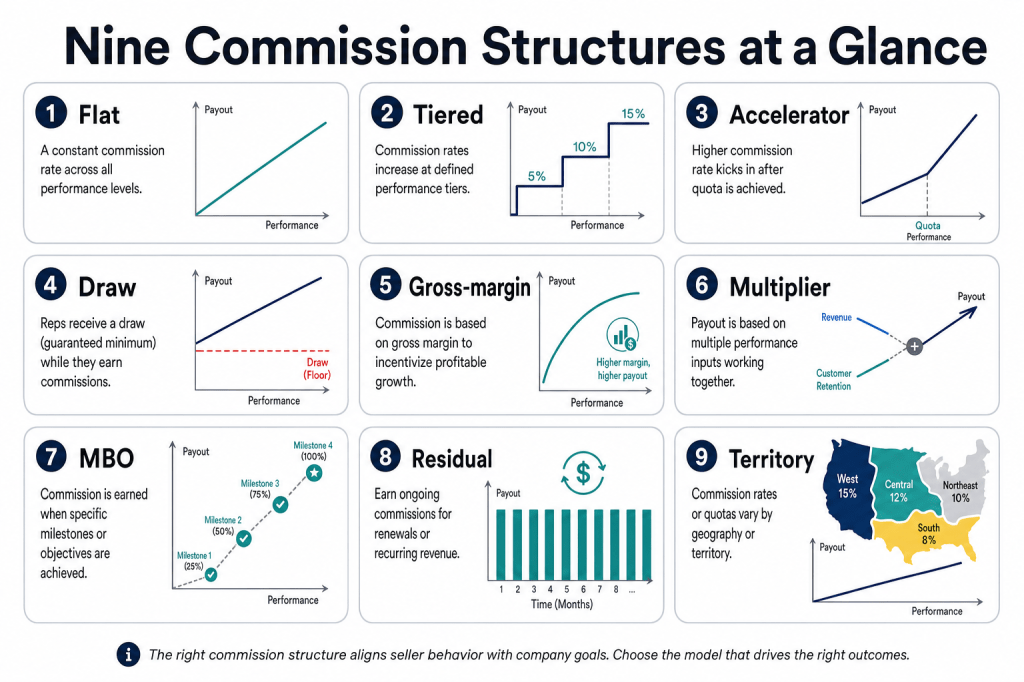
This guide walks through the nine structures that cover roughly 95 percent of B2B comp designs in 2026. Each section includes the formula, when to use it, common pitfalls, and a worked example.
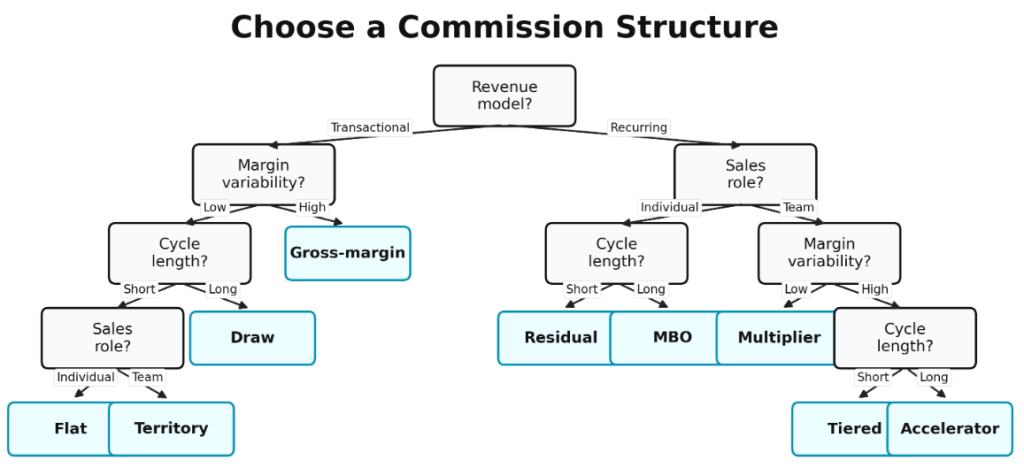
Here is a commission decision flowchart based on revenue model, margin, cycle length, and sales role:
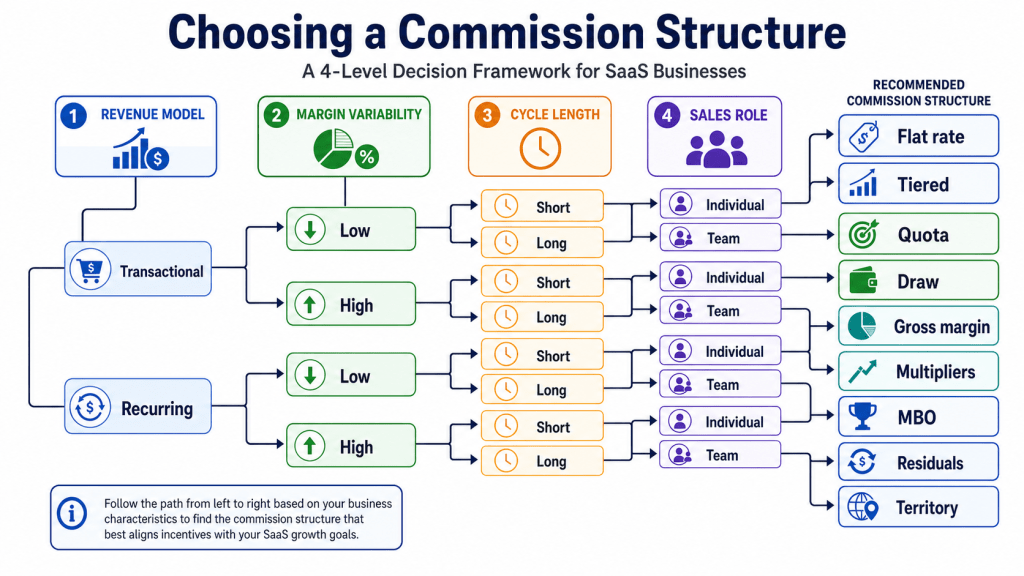
The decision question, before you pick a structure
Before structure, answer four questions:
- What outcome are you paying for? Revenue, gross margin, ARR, new logos, retention, or activity?
- Who controls the outcome? If a rep cannot influence it, do not pay them on it.
- What is the cycle? Transactional, mid-market, enterprise, or recurring?
- What is the budget? What percentage of revenue can you spend on variable comp?
WorldatWork’s annual incentive surveys show that 99 percent of public companies use short-term incentive programs and 90 percent use annual incentive plans, with median STI budgets running 6 to 7 percent of operating income. For B2B SaaS sellers specifically, total commission expense typically runs 10 to 11.5 percent of annual contract value. These benchmarks are useful guardrails when sizing any plan.
1. Flat-rate (revenue) commission
Formula: Commission = Sale Amount × Rate
When to use: Transactional sales, consistent margins, simple product lines. Common for SDR-style spiff layers and inside sales motions.
Example: Rep closes a $40,000 deal at a 7 percent flat rate. Commission = $2,800.
Watch out for: Reps will optimize for volume over margin. If your products have very different margins, this rewards selling the wrong thing.
2. Tiered commission
Formula: Each tier of cumulative sales pays a different rate. Total = Σ (Tier sales × Tier rate)
When to use: Reward higher production. Best when you want a built-in motivator without a single quota line.
Example: Tiers are 5% on the first $50K, 8% on $50K to $150K, 12% above $150K. A rep with $200K in sales earns ($50K × 5%) + ($100K × 8%) + ($50K × 12%) = $2,500 + $8,000 + $6,000 = $16,500.
Watch out for: Tier inflation at year-end. Reps may push deals into a higher-rate period rather than close them when the customer is ready.
3. Quota attainment with accelerator
Formula: Below quota: Sales × Base Rate. Above quota: (Quota × Base Rate) + ((Sales − Quota) × Base Rate × Multiplier)
When to use: The default SaaS account executive plan. Aligns clearly with revenue targets.
Example: $1M quota, 8% base, 1.5x accelerator. Rep books $1.4M. Commission = ($1M × 8%) + ($400K × 8% × 1.5) = $80,000 + $48,000 = $128,000.
Watch out for: Sandbagging. Reps near quota at month-end have a strong incentive to push deals into the next period to reset the accelerator. Use rolling quotas or YTD attainment to neutralize this.
4. Draw against commission
Formula: Payout = Max(Draw, Commission Earned). Excess earned above draw is paid. Shortfall either carries forward (recoverable) or is forgiven (non-recoverable).
When to use: New hires during ramp, long-cycle enterprise sellers, reps in markets with seasonality.
Example: $4,000 monthly draw, 10% commission rate. Rep books $30,000 in month one. Commission earned = $3,000. Rep takes home $4,000 (the draw); $1,000 carries as deficit if recoverable.
Watch out for: Recoverable draws can become a wage law issue at termination. Several states require explicit written acknowledgement before deducting deficits from final wages. Get HR and legal involved before designing.
5. Gross-margin commission
Formula: Commission = (Revenue − Cost) × Rate
When to use: Resellers, services businesses, anywhere reps have negotiating latitude on price. Aligns rep behavior with company profitability.
Example: $100K deal, $60K cost, 20% rate on margin. Commission = $40K × 20% = $8,000.
Watch out for: Cost data needs to be reliable and visible. If reps cannot see margin in real time, they cannot manage to it. Pair with a deal desk and a price floor.
6. Multiplier on attainment
Formula: Commission = Target Variable Pay × Attainment Multiplier (a piecewise function of attainment %)
When to use: Plans with multiple measures. Allows weighting (e.g., 70 percent revenue, 30 percent retention).
Example: Target variable comp $80K. Multiplier table: 0.5x at 80% attainment, 1.0x at 100%, 1.5x at 120%, 2.0x at 150%. A rep at 110% attainment earns $80K × 1.25 = $100K.
Watch out for: Cliff design. If 79.9% attainment pays nothing and 80% pays $40K, you create a deal-cramming incentive. Use linear interpolation between thresholds.
7. Management by objectives (MBO)
Formula: Commission = Σ (Objective weight × Achievement % × Bonus pool)
When to use: Sales engineers, customer success, technical roles, sales managers. Anywhere outcomes are non-revenue or shared.
Example: Quarterly bonus pool $10K. Three objectives: NPS improvement (40% weight), product certifications (30%), pipeline assists (30%). Achievements: 90%, 100%, 80%. Bonus = $10K × ((40% × 90%) + (30% × 100%) + (30% × 80%)) = $10K × 90% = $9,000.
Watch out for: Subjectivity. Define each objective with measurable criteria up front; otherwise the program creates resentment.
8. Residual commission
Formula: Commission = Recurring Revenue × Rate, paid for the life of the customer (or a defined window).
When to use: Subscription products, insurance, telecom, channel partner programs. Rewards customer retention as well as acquisition.
Example: 5% on monthly recurring revenue for 36 months. Rep closes a $5K MRR account. Each month they collect $250 for the next three years, total $9,000.
Watch out for: Tail liability. Long residuals create accruals that can dwarf current period sales. Model the schedule before launching.
9. Territory or volume bonus
Formula: Bonus paid when team or territory crosses a threshold. Often a fixed amount.
When to use: Field sales with multiple reps in a territory, bonus pools tied to district or region performance, channel partner spiffs.
Example: District hits 110% of quota; each rep gets a $5,000 spiff.
Watch out for: Free-rider risk. One strong rep can carry the territory and the rest collect. Pair with individual minimums.
Side-by-side comparison
| Structure | Best fit | Complexity | Forecast difficulty | Risk to comp budget |
|---|---|---|---|---|
| Flat-rate | Transactional | Low | Low | Low |
| Tiered | Production push | Medium | Medium | Medium |
| Quota with accelerator | SaaS AE | Medium | Medium | Medium-High |
| Draw against | Ramping reps | Medium | Medium | High |
| Gross-margin | Resellers, services | High | High | Low |
| Multiplier on attainment | Multi-measure plans | High | High | Medium |
| MBO | SE, CS, mgmt | Medium | Low | Low |
| Residual | Recurring revenue | High | High | High (tail liability) |
| Territory bonus | Field sales | Low | Low | Low |
Combining structures: real plans use stacks
Most modern plans are not one structure. They are a stack. A typical SaaS AE plan combines a quota-with-accelerator base, a residual layer for renewals, an MBO bonus on customer references, and product-specific spiffs. The structures above are building blocks, not menu choices. Document each layer separately so reps and finance can both audit them.
Quota attainment reality check
Whatever structure you pick, the quota itself drives the outcome. Salesforce’s 2024 State of Sales found 84 percent of reps missed quota in the prior year and 67 percent did not expect to hit it in the current year. If the majority of your reps cannot hit quota, the plan becomes punitive rather than motivating. The Bridge Group’s annual SaaS sales benchmarks suggest healthy plans target 60 to 70 percent of reps at or above quota. If your number is well below that, the plan is the problem before the rep is.
Plan design checklist
| Check | Why it matters |
|---|---|
| Plan is documented in plain English, not just formulas | Reps need to read it without an interpreter |
| Cap or no cap is explicit | Caps demotivate; no cap creates budget risk |
| Clawback rules and windows are written down | Avoids disputes when refunds happen |
| Effective dates on every rule | Mid-period changes do not contaminate prior deals |
| Splits are recorded at booking, not month-end | Eliminates the largest dispute category |
| Plan modeled at 50%, 100%, and 150% attainment | Surfaces budget surprises before sign-off |
| Each rep signs an acknowledgement | Removes “I didn’t know” from disputes |
Common plan-design mistakes
- Too many measures. Beyond three or four, reps stop optimizing and start guessing. Cut to the few outcomes you actually care about.
- Cliffs that feel arbitrary. If 79% attainment pays one thing and 80% pays a much higher thing, the design is causing behavior you do not want.
- Mid-year rule changes that affect deals already in pipeline. Use effective dates on every rule.
- Plans designed in isolation by finance, not stress-tested with sales leaders. If front-line managers cannot explain the plan, reps will not trust it.
- No simulator. Reps need to model their own attainment scenarios. If you cannot give them that, expect dispute volume to climb.
Bottom line
Pick the structure that matches the outcome you are paying for, document every rule, model every scenario, and put the calculation into a system that survives the next change. Plans that look elegant on a whiteboard and ugly in production share one trait, they were never tested against real data. Run the math before you launch.
Want to model any of these structures against your CRM data in minutes? Try Sales Cookie or read our companion guide on free commission spreadsheet templates.
Sources: WorldatWork annual incentive surveys; Salesforce State of Sales 2024; HubSpot State of Sales; Bridge Group SaaS Sales Compensation benchmarks; FASB ASC 340-40.
