Reading time: about 14 minutes. Six free Excel commission templates included. Best for finance and Sales Ops teams running fewer than 30 reps, or anyone who wants a working baseline before moving to automated commission software.
This is an updated version of one of our most-downloaded resources. The original 2019 templates were good for their time. They are no longer enough. Plans have gotten more complex, deal teams have gotten larger, and the audit bar under ASC 606 / 340-40 has gotten higher. The templates below cover the six most common commission structures we see in 2026, and they all download free.
We also walk through the moment every growing company hits, when the spreadsheet stops being your friend and becomes the bottleneck. If you are already past that moment, skip to the bottom.
Download the templates
Each spreadsheet is a working calculator with sample data, formulas, and a per-rep summary. Yellow cells are inputs you edit. Green cells calculate automatically. Add or remove rows as needed and update the SUM ranges if you change row counts.
| Template | Best for | Download |
|---|---|---|
| 1. Flat-Rate Commission | Transactional sales, consistent margins | Download .xlsx |
| 2. Tiered Commission (3 tiers) | Reward higher cumulative sales with higher rates | Download .xlsx |
| 3. Quota Attainment with Accelerator | SaaS account executives, mid-market and enterprise sellers | Download .xlsx |
| 4. Draw Against Commission | New hires, ramping reps, long-cycle sales | Download .xlsx |
| 5. Split Commission | Deal teams (AE / SDR / SE / Channel Partner) | Download .xlsx |
| 6. Gross-Margin Commission with Clawback | Resellers, services, contracts with refund risk | Download .xlsx |
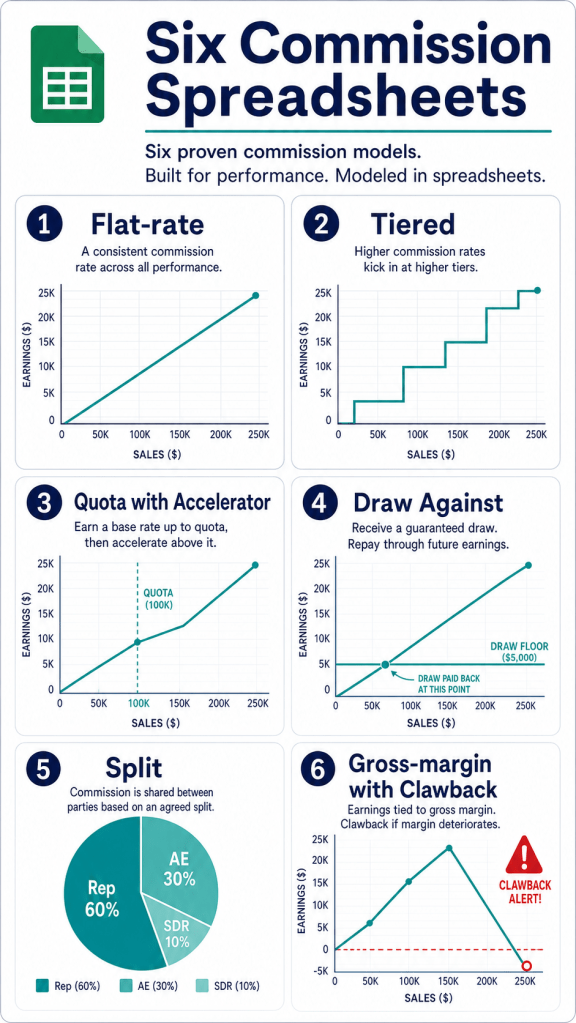
1. Flat-rate commission
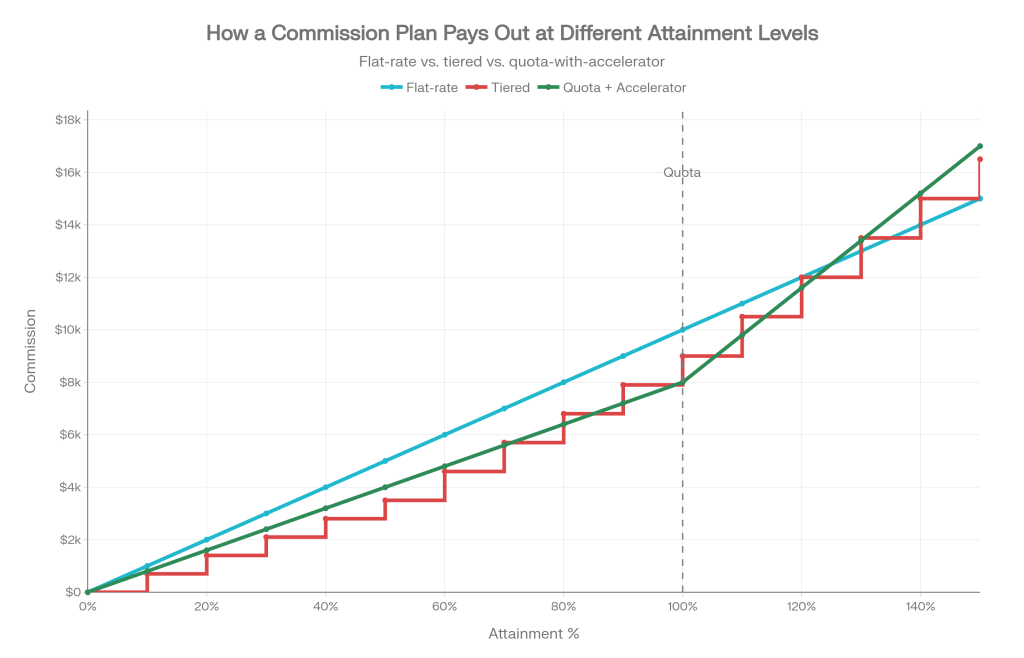
Pay a fixed percentage on every closed deal. Simple to communicate, easy to forecast, and hard to game. The downside: it does not differentiate between a rep who closes one large account and one who grinds out twenty smaller deals. Best for transactional sales with consistent margins, or for SDR-style spiff layers on top of base salary.
What’s in the template: ten sample deals, an editable rate input, per-rep totals, and totals across the team.
2. Tiered commission
The rep earns a higher rate as their cumulative sales cross thresholds. Tier 1 might be 5 percent on the first $50,000, Tier 2 might be 8 percent on $50,000 to $150,000, and Tier 3 might be 12 percent on everything above. The math splits each rep’s total into the portions that fall into each tier and pays the rate for that portion.
What’s in the template: three editable tier definitions, eight sample reps with varying performance, and a per-tier breakdown so you can see exactly which rate applied to which dollars.
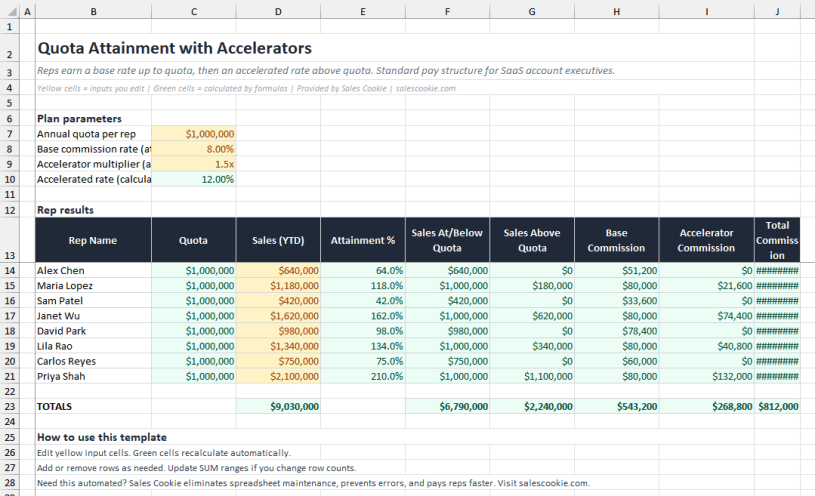
3. Quota attainment with accelerator
The standard SaaS plan. Reps earn a base rate up to quota, then an accelerated rate above quota. A 1.5x accelerator on an 8 percent base means anything above quota pays 12 percent. The template lets you adjust quota, base rate, and accelerator multiplier and watch payouts recalculate.
What’s in the template: attainment percentage per rep, the dollar amount above and below quota, base and accelerator commission columns, and team totals.

4. Draw against commission
Reps receive a guaranteed monthly draw. If their commission earned exceeds the draw, the excess pays out. If it falls short, the gap either carries forward (recoverable) or is forgiven (non-recoverable). The template tracks twelve months for one rep with a running balance.
Watch out for: recoverable draws can become a legal issue if a rep leaves with a negative balance. Several states require explicit written acknowledgement before recovering negative balances from final wages. Document carefully.
5. Split commission
Distributes commission across multiple roles on a deal. Common shape: 60 percent AE, 10 percent SDR, 10 percent Sales Engineer, 20 percent Channel Partner. The template enforces that the splits sum to 100 percent and computes each role’s payout per deal.
Splits cause more disputes than any other plan element. The fix is documentation: every deal should have its splits recorded at booking, not reconstructed at month-end.
6. Gross-margin commission with clawback
Pays commission on gross margin (revenue minus cost) instead of revenue. Aligns reps with profitability, especially in resale and services businesses. Includes clawback when a customer refunds inside a defined window. The template flags refunded deals and reverses the commission accordingly.
The hard truth about commission spreadsheets
These templates work. They will run a small team for a year. They will not survive the first time something changes, and something always changes.
Ray Panko’s research at the University of Hawaii is the foundational work on spreadsheet errors. Across studies of real-world spreadsheets, 86 to 90 percent contained at least one error, with an average cell error rate of 3.2 percent. Eighty-two percent of those errors are logic mistakes invisible to manual review. The European Spreadsheet Risks Interest Group maintains a horror story archive with hundreds of documented incidents. Five of the most cited:
| Year | Organization | What went wrong | Cost |
|---|---|---|---|
| 2012 | JP Morgan (London Whale) | Excel copy-paste error in VaR model | $6.2 billion trading loss |
| 2020 | Public Health England | XLS row limit dropped 15,841 COVID cases from contact tracing | Public health impact |
| 2003 | TransAlta | Cut-and-paste misalignment in transmission contract bid | $24 million loss |
| 1995 | Fidelity Magellan | Missing minus sign on capital gains | $2.6B incorrect dividend estimate |
| 2010 | MI5 (UK) | Formatting error swept legitimate phone numbers into wiretap list | Operational and legal exposure |
None of those incidents involved sales commission. They involved smart people, professional review processes, and a spreadsheet. That is the point.
Where commission spreadsheets specifically break
| Failure mode | What it looks like | Spreadsheet fix | Real fix |
|---|---|---|---|
| Mid-period plan change | A new accelerator activates April 1; deals on March 30 should be excluded | A new tab and hope | Effective-dated rules |
| Territory transfer | Account moves from Rep A to Rep B mid-quarter | Manual rep mapping rebuild | Versioned territory model |
| Refund or credit memo | Customer cancels in month 4; commission was paid in month 1 | Manual reversal entry | Automated clawback workflow |
| Multi-currency | Deals in EUR, GBP, AUD, USD on the same statement | Hardcoded FX rate | Daily FX from a feed |
| Audit request | “Show me how this rep was paid in Q3 2024” | Search email and OneDrive | Immutable statement archive |
| ASC 606 capitalization | Multi-year contract requires amortization | Separate amortization workbook | Automated capitalization schedule |
| Rep self-service | “How was this number calculated?” | Email back a screenshot | Drill-down portal per rep |
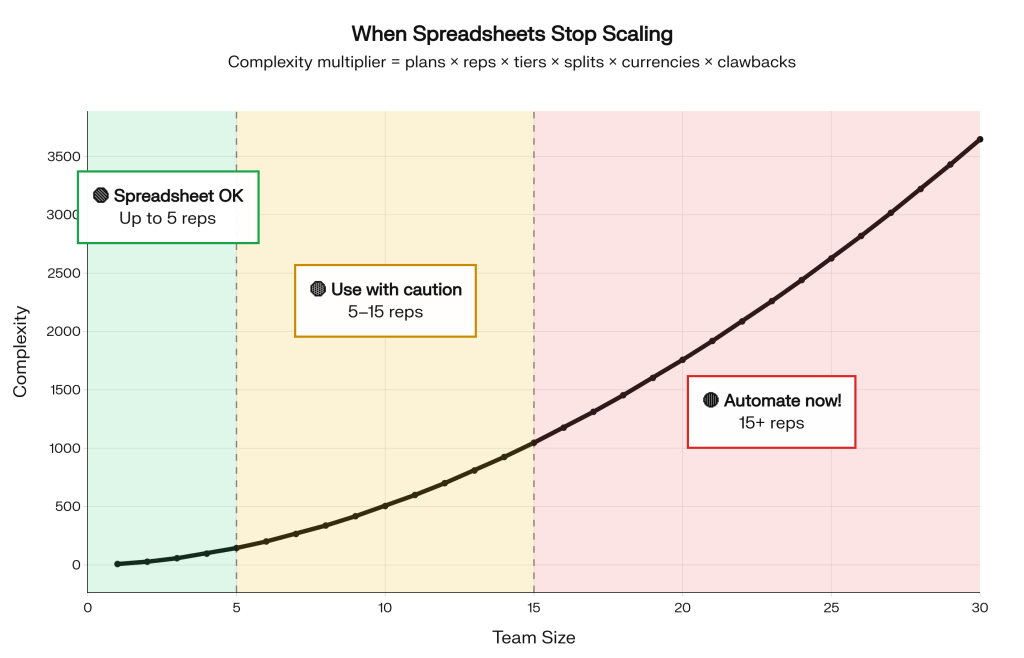
When to retire the spreadsheet
You probably already know. The honest signals:
- Month-end commission close takes more than two business days.
- You have ever paid a rep based on a number that was later proven wrong.
- Your auditor has asked for the calculation history and you could not produce it cleanly.
- One person knows how the workbook works and they are the single point of failure.
- Reps build their own shadow spreadsheets to verify your spreadsheet.
If three or more of those are true, the spreadsheet is no longer the lowest-cost option. It is the highest-cost option that hides as the lowest-cost option.
Bottom line
Use the templates. Run the math. Get the structure right. When the spreadsheet starts to fight you, do not add another tab. Move the calculation into a system built for it.
Ready to see the same calculations running automatically against your CRM? Try Sales Cookie or read the Sales Cookie blog for more on commission automation.
Sources: Panko, “What We Know About Spreadsheet Errors”; European Spreadsheet Risks Interest Group horror stories; FASB ASC 340-40; Public Health England case-loss disclosure.
