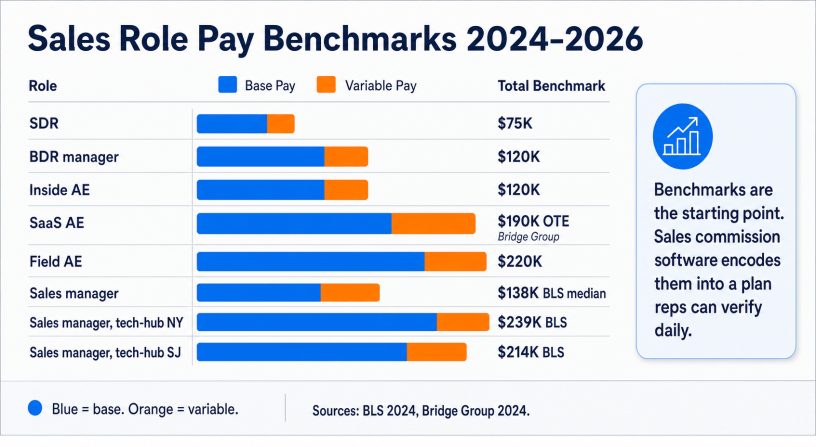
What does a good sales commission plan actually look like in numbers? This article gathers the 2024-2026 benchmarks that RevOps and finance leaders use when they design or refresh a plan: base-to-variable pay mix by role, quota-to-OTE ratios, median commission rates, industry-level attainment mixes, and how sales commission software turns these benchmarks into a working plan. If you are calibrating a plan or defending one to your CFO, this is the reference table you want on your desk.
Sales commission plans get set once a year, argued about all year, and rewritten the next January. The reason the argument never ends is that most teams do not have a shared reference for what “normal” looks like. This piece pulls the most-cited benchmarks from BLS, Bridge Group, Alexander Group, and industry incentive research, then shows how a sales commission software turns those numbers into a functioning plan. The goal is to give you a single reference for the four most-asked questions in commission design: how much of pay should be variable, what should the quota-to-OTE ratio be, what commission rate is defensible, and what percentage of reps should hit quota.
1. Pay mix: what percentage of pay should be variable?
The base-to-variable split is the first design decision in any commission plan. The 2024-2026 benchmarks converge on a clear pattern: the more directly a role controls closed revenue, the more variable the pay mix. For an account executive, the most common structure is a 50/50 base-to-variable split. Among SaaS AEs specifically, Bridge Group’s 2024 benchmark reports a base-to-variable of 53:47, which is close enough to 50/50 that most teams treat them as interchangeable (Bridge Group).
SDRs and BDRs, whose role is upstream of closed revenue, sit at 60-70 percent base and 30-40 percent variable. Sales managers typically run 65/35 to 70/30, reflecting that their variable component is tied to team performance rather than personal deals. CSMs at renewal-oriented organizations run 70/30 or 80/20, weighted toward base because retention is largely about consistency rather than closing.
| Role | Typical base-to-variable | Why the split works |
|---|---|---|
| SDR / BDR | 60/40 to 70/30 | Activity-driven role; deals are shared credit with the closing AE. |
| Inside AE | 55/45 to 50/50 | Short-cycle deals; variable rewards throughput and consistency. |
| Field / Enterprise AE | 50/50 | Long cycle, large deal size; variable balances risk of dry quarters. |
| Sales manager | 65/35 to 70/30 | Variable is team-based; base reflects coaching and enablement load. |
| Solutions engineer | 70/30 to 75/25 | Deal-support role; variable ties to attach or team quota. |
| CSM (renewal-focused) | 70/30 to 80/20 | Retention-focused; variable weighted toward NRR and expansion. |
The other data point worth internalizing is 71 percent of organizations now use pay-for-performance models, directly tying earnings to specific, measurable outcomes. This is the baseline expectation. A commission plan that pays a flat bonus without clear tie to measurable outcomes is out of step with roughly three-quarters of the market. Sales commission software makes it much easier to enforce the tie, because the outcome measurement is encoded into the plan rather than sitting in a manager’s spreadsheet.
2. Quota-to-OTE ratio: how big should the quota be?
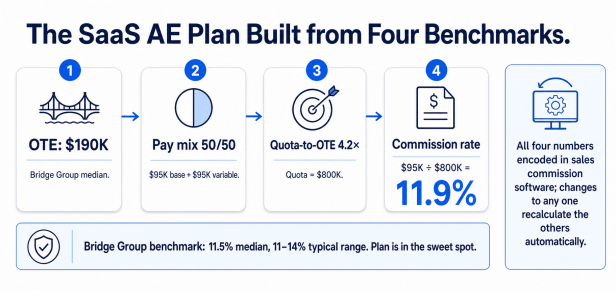
The quota-to-OTE ratio is the answer to a different question: if a rep hits 100 percent of quota, how much revenue do they produce per dollar of OTE? Bridge Group’s 2024 SaaS AE benchmark puts this ratio at a median of 4.2x, meaning an AE with $190K OTE (also the SaaS AE median in the same report) is carrying a roughly $800K quota. Most healthy SaaS organizations run between 3x and 6x. Below 3x, the plan is too generous; the company loses money on every quota-hitter. Above 6x, the plan is too tight; reps disengage or quit.
The quota-to-OTE ratio should be set once at plan design and revisited only when the underlying gross margin or sales cycle changes materially. Sales commission software helps here by making the ratio visible on every plan document and by giving the RevOps team a single view of ratios across roles and geographies. When a manager tries to negotiate a special quota for a favorite rep, the software surfaces the resulting ratio and forces the conversation to be explicit.
3. Commission rate: what percentage of ACV should the AE earn?
Bridge Group also gives us the commission rate benchmark. The median SaaS AE commission rate is 11.5 percent of ACV at 100 percent quota attainment, with typical rates ranging from 11 percent to 14 percent. That figure is the aggregate commission rate at target, not any single line item. It includes accelerators up to plan expectation and reflects the full variable pool.
If you are designing a plan from scratch, the arithmetic is: variable pool at target divided by quota at target equals commission rate at target. For a SaaS AE with $190K OTE, 50/50 pay mix, and $800K quota, the rate is $95K variable divided by $800K quota, or 11.9 percent. That is directly in line with the Bridge Group benchmark, which is a good validation that the math is defensible.
4. Quota attainment: what percentage of reps should hit quota?
This is the most-argued question in commission design, and the data is clearer than most leaders realize. The Alexander Group’s 2023 benchmark shows that 49 percent of core sellers achieved or exceeded quota, and 51 percent achieved or exceeded target incentive, with average aggregate attainment across surveyed organizations at 89 percent (Alexander Group Insights). In healthy organizations, high-performing teams see 70 percent-plus of scaled reps hitting quota, and often net out to around 60 percent overall attainment mix.
The design implication is that a properly set plan should produce roughly half the team above quota. If your plan is putting 80 percent of the team above quota, quotas are too low and the plan is overpaying. If it is putting only 15-20 percent above, quotas are too high and the plan is under-motivating. Both failure modes are common. Sales commission software helps by giving RevOps a live view of the attainment distribution mid-quarter, which allows a mid-year re-calibration to happen before the whole year is lost.
5. Industry variation: quota-driven pay is nearly universal, with one exception
Whether quota attainment is a component of the commission plan varies less than most people think. The industry-level data shows quota attainment featuring in a large majority of plans in every sector that publishes:
| Industry | % org. using quotas | Design implication |
|---|---|---|
| Technology | 82% | Attainment-based plans are the near-universal norm. |
| Financial services | 79% | Attainment paired with regulated metrics (AUM, book size). |
| Retail | 79% | Attainment tied to store or territory targets. |
| Manufacturing | 67% | Attainment often blended with margin or product-mix targets. |
Manufacturing sits noticeably below the others because pay-for-margin structures often play a larger role than pay-for-attainment. In technology, at 82 percent, attainment-based plans are essentially the industry standard.
6. Structured incentives lift performance 22 to 44 percent
The most durable performance number in the incentive-design literature comes from the IRF. Properly structured incentive programs increase performance by an average of 22 percent and by as much as 44 percent (Incentive Research Foundation). Two subsidiary findings matter for plan design:
- Programs tied to a specific goal yield a 27 percent lift on average.
- Programs lasting a year or more yield a 44 percent lift, versus 30 percent for six-month programs and 20 percent for week-long programs.
The implication for plan design is that short-term SPIFs and week-long contests underperform annual programs by roughly a factor of two. If you find yourself running a lot of short-term contests, you probably have a plan-clarity problem rather than a motivation problem. A cleaner primary plan, encoded in a sales commission software with real-time attainment, will move performance more than the SPIF calendar. For deeper treatment, see our tiered commission structures and quota accelerators guides.
7. The productivity multiplier: sellers spend only 30 percent of the week selling
Even the best-designed plan is diluted by the productivity ceiling. Salesforce research shows that reps spend only 30 percent of their average week actually selling and 70 percent on non-selling work (Salesforce State of Sales). Bain has separately estimated that AI-assisted sales tools can roughly double the share of time sellers spend selling, from about 25 percent to 50 percent, and that AI-assisted teams see approximately 30 percent productivity gains (Bain Insights).
The plan design lesson is that the payout math can only reward what actually happens. If your reps are spending 70 percent of the week on non-selling activity, your quota-to-OTE ratio should be calibrated against 30 percent selling capacity, not 100 percent. Sales commission software plays a role here by removing one of the categories of non-selling work (shadow accounting, statement reconciliation, dispute follow-ups) from the reps’ weeks, which raises the effective selling time and, therefore, the achievable quota.
8. Salary bands: what do the roles actually pay?
The U.S. Bureau of Labor Statistics provides the most defensible salary benchmarks for the underlying roles. From the May 2024 OES data (BLS OES):
- Sales managers: median annual pay of $138,060. Lowest 10 percent under $66,910; highest 10 percent over $239,200.
- Sales managers in New York, Newark, Jersey City: median $239,440.
- Sales managers in San Jose, Sunnyvale, Santa Clara: average $214,590.
- Sales managers in professional/scientific/technical services: median $165,050.
- Sales managers in finance and insurance: median $164,990.
- Wholesale/manufacturing reps selling technical and scientific products: median $100,070.
- Wholesale/manufacturing reps excluding technical and scientific products: median $66,780.
- Employment of sales managers is projected to grow 5 percent from 2024 to 2034, with about 49,000 openings per year.
For a SaaS AE, Bridge Group’s median OTE of $190K is a better benchmark than any BLS category, because the BLS aggregates across industries. When you combine the BLS regional data with a SaaS-specific benchmark like Bridge Group, you get a defensible range for both the base and the OTE at any given role.
How sales commission software puts the benchmarks to work
Benchmarks are useful only if they show up in the actual plan. In practice, a mature sales commission software gives the RevOps team four capabilities that convert the industry numbers above into an operating plan:
| Capability | Benchmark it operationalizes | Operational payoff |
|---|---|---|
| Role-based plan templates | Pay mix by role (SDR 70/30, AE 50/50, CSM 80/20) | New roles get consistent, benchmarked plans without custom design. |
| Quota-to-OTE guardrails | Bridge Group median 4.2x | Assignments that violate the ratio are flagged before they go live. |
| Attainment distribution dashboard | Alexander Group 49% at-or-above quota | RevOps sees mid-quarter whether quotas are calibrated correctly. |
| Real-time rep view | 76% of reps want comp transparency; IRF 22-44% structured lift | The structural clarity that turns the benchmark into performance. |
The takeaway: benchmarks first, software second, plan third
A well-designed sales commission plan is not a work of art. It is an application of published benchmarks to your specific team, encoded in a system your reps can verify daily. The 50/50 pay mix, the 4.2x quota-to-OTE ratio, the 11.5 percent commission rate, and the 49 percent attainment mix are the four numbers that anchor the design. The IRF’s 22 to 44 percent performance lift is the number that quantifies the upside of getting the design right. Sales commission software is the mechanism that keeps the design intact once the plan is live: no spreadsheet drift, no verbal quota changes, no shadow accounting, no dispute backlog.
If you are refreshing your plan for the next fiscal year, use the benchmarks in this article as the reference point, then use a sales commission software to encode the result. That sequence produces a plan that survives contact with the sales team, the finance close, and the audit.
Related reading
- OTE (on-target earnings) explained
- Tiered commission structures
- Quota accelerators: caps, floors, and structure
- Sales quota attainment benchmarks
- Flat-rate commission structures
- Draw against commission
- The sales commission statement
Sources
- Bridge Group SaaS AE Benchmark: bridgegroupinc.com: 2024 SaaS AE OTE, pay mix, quota ratio, commission rate.
- Alexander Group Insights: alexandergroup.com/insights: 2023 quota attainment and target incentive achievement.
- U.S. Bureau of Labor Statistics OES: bls.gov OES: 2024 sales manager and sales rep median pay.
- Incentive Research Foundation: theirf.org: structured incentive performance lifts.
- Salesforce State of Sales Report: salesforce.com/state-of-sales: rep time allocation.
- Bain & Company Insights: bain.com/insights: AI and sales productivity gains.
- HubSpot Sales Trends Report: hubspot.com/state-of-sales: sales-metric prioritization.
- Sales Cookie internal deployment benchmarks: multi-role plan design, attainment distribution, and mid-year recalibration patterns.

