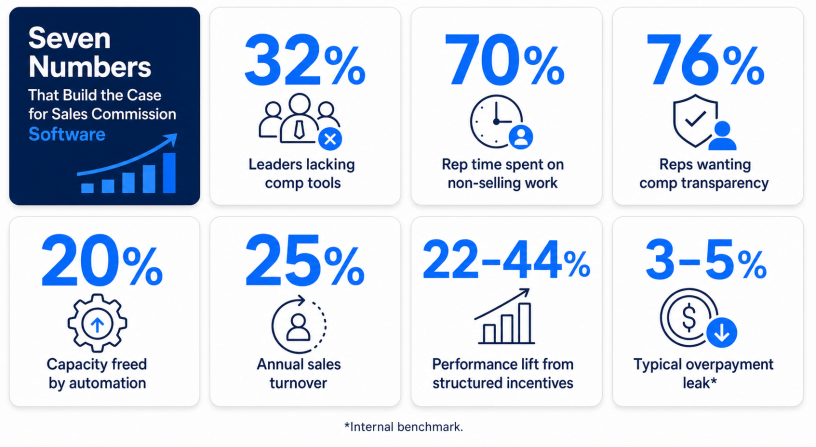
The case for sales commission software is not made with slogans. It is made with numbers. This article gathers the 2025-2026 statistics that RevOps, finance, and sales leaders are quoting when they build the business case to automate their commission process, and organizes them into the specific problems that a modern sales commission software solves. If you are evaluating commission automation, this is the data your CFO is going to ask for.
Sales commission software has moved from a nice-to-have to a core RevOps system. The reason is visible in the numbers: sales teams are spending most of their week on non-selling work, one in three sales leaders now says their tech stack is missing compensation management outright, and three out of four reps want more transparency in how their pay is calculated. The gap between how commission plans are designed and how they are actually experienced is exactly the gap that sales commission software closes. Below, we walk through the seven categories of statistics that come up in every commission automation business case, and what they mean for your ROI calculation.
1. One in three sales leaders says their tech stack is missing commission management
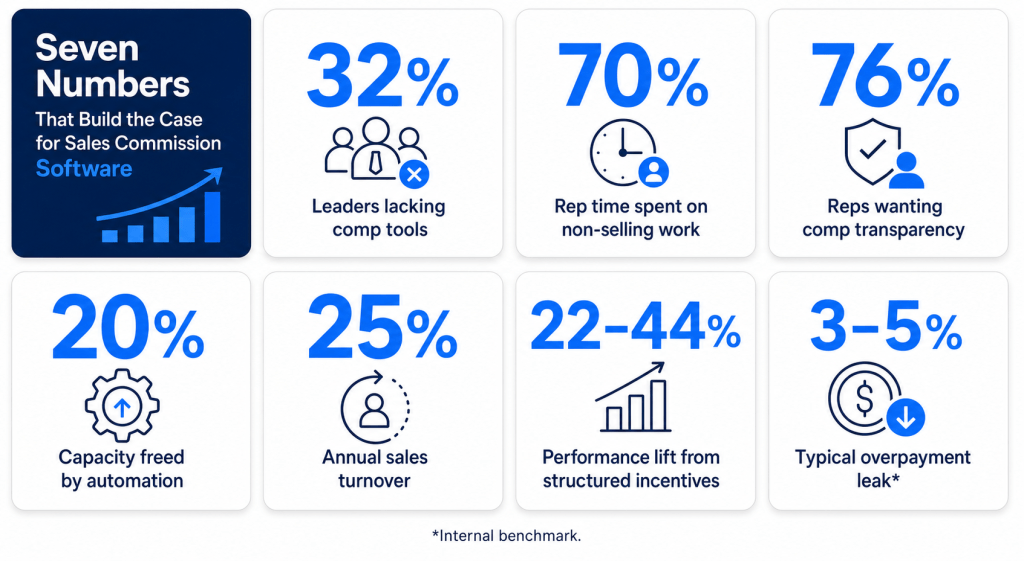
The single most direct statistic in the commission software debate is that 32 percent of sales leaders say their tech stacks lack compensation management capabilities. That is one in three revenue organizations running a critical pay function without a purpose-built system. In practice, “lacks compensation management” almost always means one of three things: a shared spreadsheet that a single analyst owns, a homegrown script that a departed engineer built, or a set of CRM reports that produce the raw numbers but not the plan logic. All three fail at the same predictable moments: plan changes mid-year, multi-currency deals, tiered accelerators, clawbacks, and disputes.
For a sales commission software business case, the 32 percent figure sets the anchor. You are not proposing to replace an established best-in-class system. You are proposing to fill a gap that a third of the industry has explicitly acknowledged. That reframes the conversation from “why change” to “why haven’t we already.”
2. Reps spend 70 percent of the week on non-selling work
The productivity gap is bigger than most leaders admit. According to Salesforce research, sales reps spend only 30 percent of their average week actually selling, and 70 percent on non-selling work (Salesforce State of Sales). A meaningful slice of that 70 percent is commission-adjacent: reconciling personal spreadsheets against the official calc, chasing missing deals, disputing statement lines, modeling accelerator scenarios, and re-explaining the plan to peers and managers.
Sales commission software attacks this directly. When a rep can see, in real time, every deal they have closed, exactly how it maps to the plan, and exactly what they will be paid, the incentive to run a parallel spreadsheet disappears. This is the mechanism behind the phrase “shadow accounting elimination” that shows up in modern commission platform pitches. It is not a soft benefit. Recovering even one rep-hour per week per rep on a 50-person team is 2,600 selling hours added back per year.
3. 76 percent of reps want more transparency in how their pay is calculated
Three-quarters of sales professionals wish there was more transparency into how their compensation is calculated. In parallel, 73 percent say they know the commission owed on every deal, which means one out of four does not. The delta between the two statistics is the daily friction of a plan the rep cannot verify.
Transparency is not a UX feature; it is the primary output of a commission system. A well-implemented sales commission software puts the plan document, the deal-level calculation, and the payout schedule in one place, and shows every rep exactly the same view every day. That single change moves the transparency number from “wishing for it” to “have it.” For a deeper treatment, see our commission statement anatomy guide.
4. Automating non-selling work frees roughly 20 percent of team capacity
McKinsey’s research on sales automation is one of the most-quoted numbers in commission software business cases: automating non-customer-facing activities can free up about 20 percent of a sales team’s capacity (McKinsey Growth, Marketing and Sales). A 20 percent capacity gain on a $10M-quota team is the equivalent of adding two full quotas worth of selling time without hiring.
Commission calculation and dispute resolution are among the most automatable of the non-customer-facing activities. Bain has estimated that AI-assisted sales tools can roughly double the share of time sellers spend actually selling, from about 25 percent to 50 percent (Bain Insights), and that AI-assisted teams see approximately 30 percent productivity gains. Commission software sits directly in that automation stack.
5. Sales turnover is running at 25 percent per year, and comp is a lead cause
Sales teams saw a 25 percent average turnover rate over the past year. Comp is not the only driver, but it is a leading one, and a rep who cannot verify their pay is significantly more likely to disengage. The cost of replacing a fully ramped sales rep, including recruiting fees, ramp time, and lost pipeline, is typically 1.5x to 2x their fully loaded annual cost. For a 50-rep team with a 25 percent turnover rate and a $150K fully loaded cost per rep, that is roughly $2.8M in annual replacement cost.
Sales commission software will not eliminate turnover, but it removes the specific category of turnover that traces back to pay disputes, unclear plans, and delayed payouts. Combined with the average sales ramp time of 3.2 months, every retained rep is 3.2 months of ramp cost avoided. That is a category of value that goes straight to the CFO’s ROI model.
6. Structured incentives lift performance 22-44 percent when the plan is clear
The IRF (Incentive Research Foundation) has established two of the most durable numbers in incentive design. Properly structured incentive programs increase performance by an average of 22 percent and by as much as 44 percent. Incentive programs tied to a specific goal produce a 27 percent average performance lift, and programs lasting a year or more produce a 44 percent lift versus 30 percent for six-month programs and 20 percent for programs lasting a week or less (Incentive Research Foundation).
The word doing the work in the IRF finding is “structured.” A plan that lives in a static PDF and is opaque to the rep does not produce those lifts. The same plan, encoded in a sales commission software that shows the rep their attainment, their next accelerator threshold, and their payout in real time, does. Structure is not the same as complexity. It is the same as “clear enough that a rep can plan against it.”
7. Only 49 percent of reps hit quota; 89 percent is the plan-target average
The Alexander Group’s 2023 benchmark found that average quota attainment across surveyed organizations was 89 percent, that 49 percent of core sellers achieved or exceeded quota, and that 51 percent achieved or exceeded target incentive (Alexander Group Insights). The two numbers together are the diagnostic every RevOps leader should be running: if your team’s attainment mix is far from 49 percent hitting quota and 89 percent aggregate attainment, you have either a plan design problem or a plan clarity problem.
Sales commission software helps in two ways. First, real-time attainment visibility gives reps a chance to close the gap before the quarter ends, instead of after. Second, when the plan is clear enough that reps trust the calculation, they focus on selling instead of self-auditing. For related discipline, see our quota attainment and tiered commission structure guides.
Putting the numbers together: the ROI table
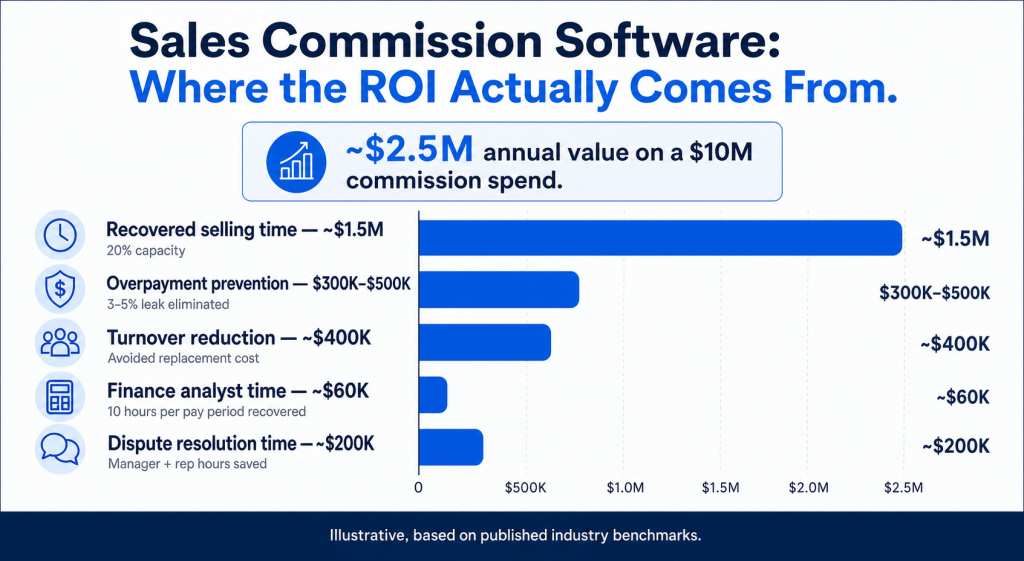
For a business case, translate the industry statistics into your own numbers. The table below shows the seven levers, the industry benchmark, and how each translates to dollar value on a hypothetical $10M annual commission spend program with 50 reps.
| Lever | Industry benchmark | Illustrative amount |
|---|---|---|
| Recovered selling time | 20% capacity gain from automation (McKinsey) | Roughly $1.5M in incremental pipeline capacity |
| Overpayment prevention | 3-5% typical overpayment leak on manual processes | $300K-$500K in direct comp savings per year |
| Turnover reduction | 25% baseline turnover; 2-3 points comp-driven | Roughly $300K-$400K in avoided replacement cost |
| Finance analyst time | 1-2 FTE-equivalents on manual comp for 50-rep teams | $60K-$180K in reallocated analyst capacity |
| Dispute resolution | Manager and rep hours on statement disputes | Approximately $200K in avoided labor |
| Structured-incentive lift | 22-44% performance lift from clear, structured plans (IRF) | Incremental revenue, plan-specific |
| Audit and compliance | Reduced audit prep, tighter SOX-relevant controls | $50K-$150K in avoided external audit time |
What sales commission software actually does, mapped to the numbers
Buyers evaluating sales commission software often ask what the feature set does in practical terms. The mapping is straightforward. Every one of the industry statistics above corresponds to a specific capability that a modern commission platform delivers.
| Capability | Statistic it addresses | How we deliver it |
|---|---|---|
| Real-time rep dashboards | 76% want comp transparency | Every rep sees deal-level attainment, accelerator progress, and projected payout in real time. |
| Automated calculation engine | 32% of leaders lack comp tools; 20% capacity gain (McKinsey) | Rules encoded once; every quarter runs without spreadsheet rework. |
| Clawback and adjustment logic | 3-5% overpayment leak | Cancellations, refunds, and post-close adjustments automatically flow back into the payout. |
| In-line dispute workflow | Rep and manager hours lost to email disputes | A dispute button on every statement line, routed to the plan owner with SLA tracking. |
| Plan version control | Mid-year plan changes that break historical calcs | Every plan carries an effective-dated version; historical periods stay reproducible. |
| Multi-currency and FX | Global teams with mixed-currency quotas | One canonical FX policy per plan, applied consistently on every deal. |
| Audit log and export | SOX and finance audit exposure | Every calculation traceable to source data, plan version, and approval. |

How to build the business case
If you are the RevOps or finance leader making the case internally, the sequence that works is this. First, take your own annual commission spend and multiply by 3 percent to get the low-end estimate of the overpayment leak. That number alone is usually larger than the annual cost of the platform. Second, count the analyst hours per pay period spent on commission spreadsheets and multiply by the fully loaded hourly cost of those analysts. Third, apply the 20 percent capacity gain from McKinsey to your rep team’s fully loaded cost as an upper bound on the productivity opportunity, and pick a defensible fraction (10 percent is a conservative choice) for the working number.
Add those three lines together and compare to the platform’s annual cost. On most mid-market deployments the payback is measured in months, not years. The four remaining lines in the ROI table (turnover, dispute resolution, structured-incentive lift, and audit) are typically not needed to justify the purchase; they are bonus value that shows up in year two.
The bottom line on sales commission software in 2026
The 2026 data is unusually consistent. Sales teams are spending most of their week on non-selling work. Reps do not fully trust the numbers they are being paid. Finance analysts are absorbing an unreasonable share of the mechanical calculation load. Turnover is running at 25 percent and comp confusion is one of the reasons. Meanwhile, McKinsey has quantified a 20 percent capacity gain from automation, Bain has shown that AI-assisted teams see 30 percent productivity gains, and the IRF has shown that structured incentive programs lift performance 22 to 44 percent. Every one of those statistics points in the same direction: sales commission software is no longer a discretionary category. It is the system that makes the other numbers work.
If you are the person tasked with automating your commission process, the argument is already made for you by the data. What remains is the choice of platform, the plan design cleanup, and the change management. Sales Cookie was built specifically for the 32 percent of leaders who acknowledged they need a system, and for the 76 percent of reps who asked for transparency. If you would like to walk through what your own numbers look like on the ROI table above, we would be happy to sit down with them.
Related reading
- Preventing sales commission overpayments
- Shadow accounting in sales
- The sales commission statement: anatomy and best practices
- Sales quota attainment
- Tiered commission structures
- OTE (on-target earnings) explained
- Multi-currency sales commissions
Sources
- McKinsey Growth, Marketing and Sales: mckinsey.com: automation and sales capacity research.
- Bain & Company Insights: bain.com/insights: AI and sales productivity.
- Salesforce State of Sales Report: salesforce.com/state-of-sales: rep time allocation and productivity.
- Alexander Group Insights: alexandergroup.com/insights: 2023 quota attainment benchmarks.
- Incentive Research Foundation: theirf.org: structured incentive performance lifts.
- U.S. Bureau of Labor Statistics: bls.gov OES: 2024 sales manager and sales rep median pay.
- Bridge Group SaaS AE Benchmark: bridgegroupinc.com: 2024 SaaS AE OTE, pay mix, quota ratios.
- HubSpot Sales Trends Report: hubspot.com/state-of-sales: sales-metric prioritization.
- Sales Cookie internal deployment benchmarks: overpayment leak, dispute rate, and analyst time recovery.

