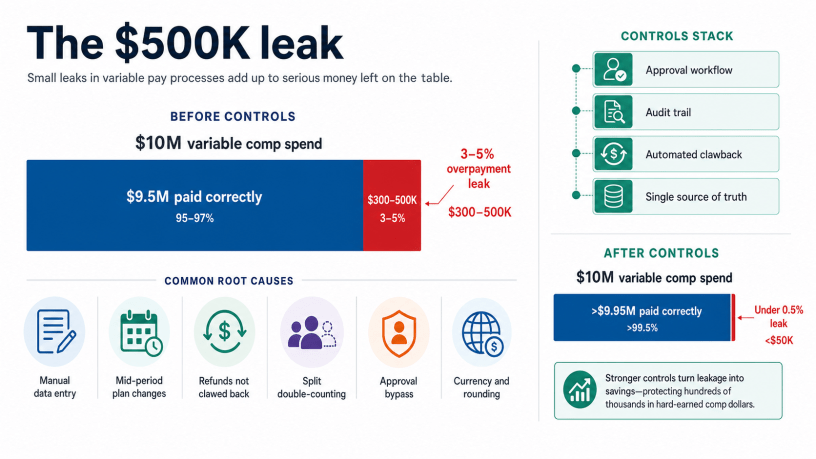
Reading time: about 11 minutes. Gartner puts variable-comp overpayments at 3 to 5 percent of variable spend. Independent industry research finds 83 percent of companies have payment inaccuracies averaging over 5 percent. This article translates those percentages into dollars, identifies the six root causes, and lays out a seven-control framework that any finance or sales-ops leader can implement in one quarter.
Overpayments are the quietest expensive problem in sales operations. Underpayments generate loud, tracked, formal disputes. Overpayments generate silence: the rep who received an extra $8,000 for a deal that should have been split has no incentive to raise the flag, and often does not even know a mistake happened. The mistakes accumulate month over month, and finance discovers them, if at all, during an annual audit or when a new commission platform reconciles old data.
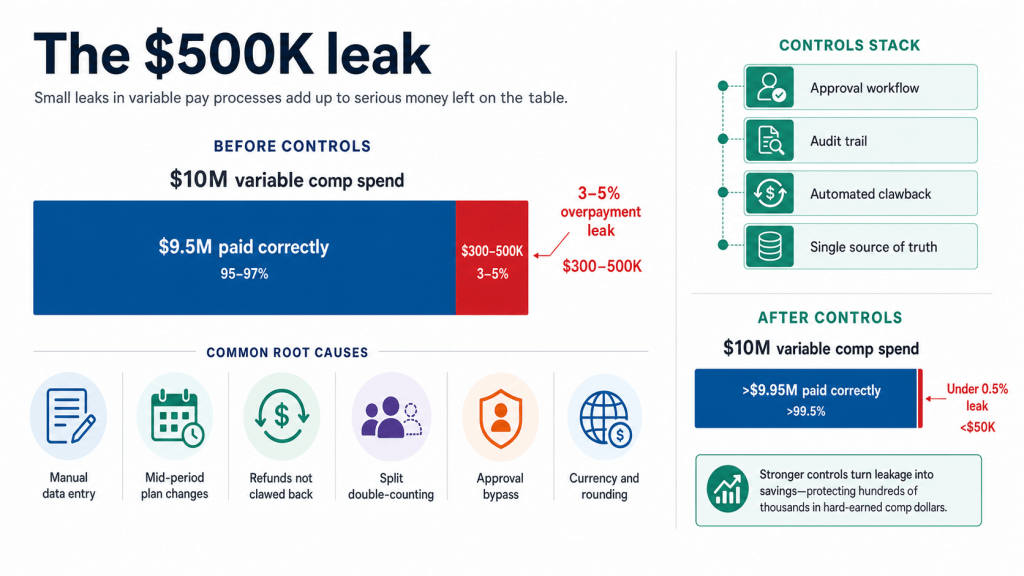
Two industry data points frame the size of the problem. Gartner puts the typical overpayment leakage at 3 to 5 percent of total variable compensation spend for companies without strong controls. Separate industry research cited on the Sales Cookie University page finds that 83 percent of companies have payment inaccuracies averaging over 5 percent. Sales Cookie’s own interview data with 86 North American SMB sales management professionals reported a 4.2 percent overpayment rate. Whatever the exact figure, it is not a rounding error. For a company with $10 million in annual variable spend, the range implies $300,000 to $500,000 leaked every year to overpayments the business cannot recover.
The six root causes of overpayments
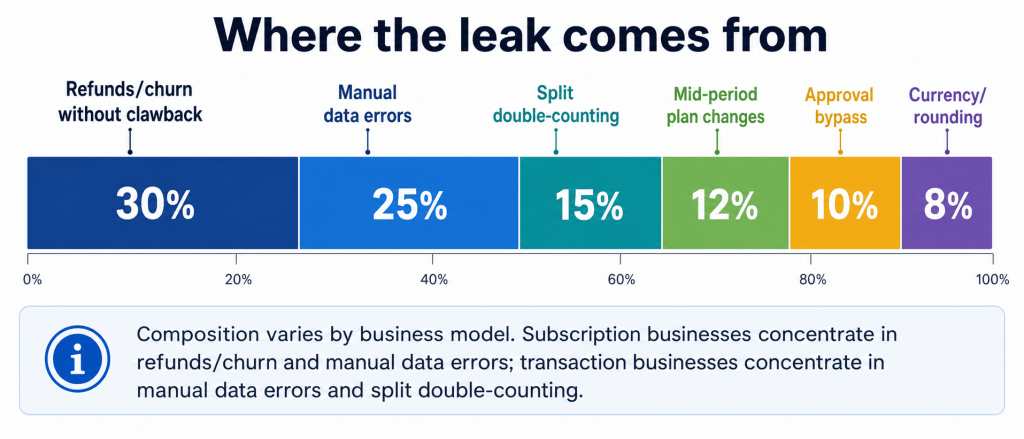
Every overpayment traces back to one of six causes. A control framework has to address all six or the leak simply relocates.
Cause 1: Manual data entry and transcription
Commission calculations built by copying numbers from the CRM into a spreadsheet, or by exporting a CSV and applying VLOOKUPs across worksheets, have well-documented cell-level error rates. Raymond Panko’s spreadsheet research puts cell-level error rates at roughly 1 percent in non-trivial financial models. Applied to hundreds of transactions per cycle across dozens of reps, that percentage generates a steady stream of overstated payouts.
Cause 2: Mid-period plan or quota changes
Territory reassignments, quota adjustments, rate changes, or new SPIF layers introduced mid-period are especially prone to overpayments. The old plan continues to run for some transactions while the new plan runs for others, and the boundary case (a deal booked before the change but invoiced after) frequently gets credited under both.
Cause 3: Refunds, cancellations, and churn without clawback
The commission gets paid on booking. The customer cancels or refunds three months later. If the plan does not have a clawback clause, or if the clawback is not systematically triggered when the reversal event is recorded in the CRM or billing system, the commission stays paid on revenue that never materialized. This is the single most common overpayment category in subscription businesses.
Cause 4: Split and team crediting double-counting
Splits that are not enforced to sum to exactly 100 percent (or 200 percent, in the case of double-credited joint quotas) are a common failure. So are team credits where every rep on the deal gets full credit and no one enforces the split at all. Gross overpayment is easy to spot; the more subtle version is a 60/50 split where two reps received 110 percent of the commission between them.
Cause 5: Approval bypass and manual overrides
A manager approves a one-time exception for a specific deal. Six months later, no one remembers whether the exception was one-time or standing. Manual overrides without a reason code, an approval trail, and an explicit expiration date tend to become permanent because nobody wants to be the person who reverses a rep’s pay increase.
Cause 6: Currency conversion and rounding
International teams often see systematic overpayment from stale exchange rates (using last quarter’s rate for this quarter’s deals) or from applying different rounding conventions at each stage of the calculation. Individually small, aggregated meaningful.
Quantifying the leak in your own P&L
The overpayment leak is invisible until you size it. A five-number back-of-envelope calculation is enough to make the case at a management team meeting.
| Input | Example | Notes |
|---|---|---|
| Annual variable comp spend | $10,000,000 | Sum of target variable at plan across all commissioned employees, plus expected accelerator payout. |
| Overpayment rate (low) | 3.0% | Gartner low end for companies without strong controls. |
| Overpayment rate (mid) | 4.2% | Sales Cookie SMB survey. |
| Overpayment rate (high) | 5.0%+ | Gartner high end; separate industry research suggests many companies exceed 5%. |
| Implied annual leak range | $300,000 – $500,000+ | Assuming no strong controls. |
Two observations. First, even the low end of this range often exceeds the annual cost of a commission platform, which is why the ROI conversation for automation usually starts and ends with overpayment prevention (see our huge ROI of commission software analysis). Second, the leak is asymmetric. Underpayments get corrected because reps complain. Overpayments are almost never recovered because recovery requires either a clawback clause (many plans lack one), the political will to invoke it (rare), or the ability to reconstruct the original error (harder than it sounds when the plan is a spreadsheet).
A seven-control framework that closes the leak
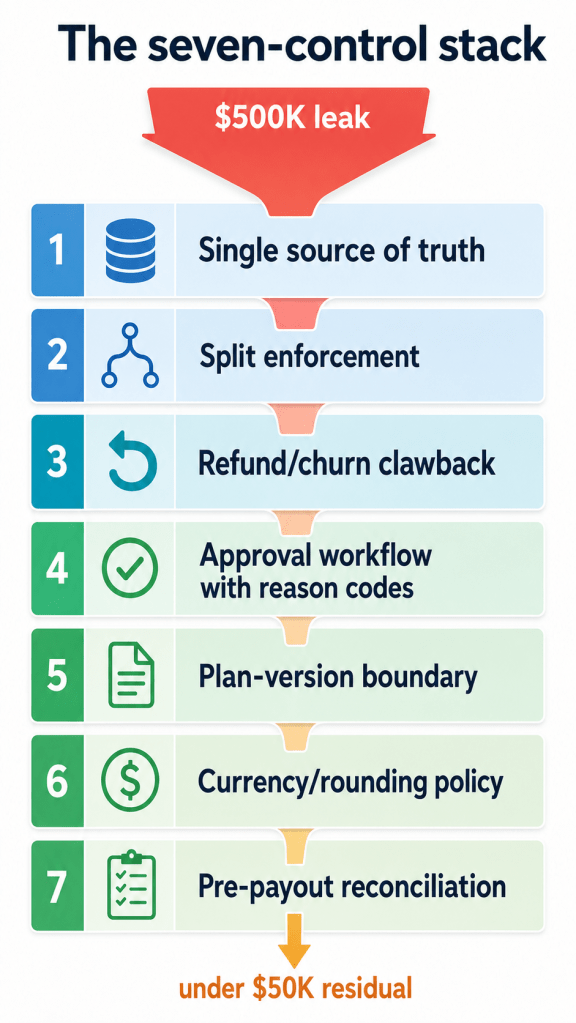
Overpayment prevention is not a single control. It is a stack of controls arranged so that a single failure cannot let a large overpayment through. The stack has seven layers.
| Control | What it prevents | Implementation |
|---|---|---|
| 1. Single source of truth for transactions | Manual transcription errors, mismatched deal amounts | Direct sync from CRM or billing system with a defined refresh cadence and a change log. |
| 2. Automated split enforcement | Splits that sum to more than the intended total | System-level validation that splits sum to a plan-defined total per deal; block save otherwise. |
| 3. Refund and churn feed with clawback logic | Commissions paid on revenue that later reversed | Cancel or refund events in billing trigger a retroactive true-up in the next commission cycle. See our retroactive corrections deep-dive. |
| 4. Approval workflow with reason codes | Undocumented manual overrides that become permanent | Every adjustment recorded with adjuster, approver, reason code, and expiration; see manager override workflow. |
| 5. Plan-version boundary rules | Mid-period overpayments when plans change | Each transaction pinned to a specific plan version by its earning event date; the crediting engine picks the correct plan. |
| 6. Currency and rounding policy | Systematic currency and rounding leakage | Documented FX source and cadence, defined rounding stage (once at final payout, not at every intermediate step). |
| 7. Pre-payout reconciliation and analytics | Any residual issue not caught by controls 1 through 6 | Automated comparison of current-period payout against expected distribution (bell curve of attainment, outlier detection, month-over-month variance). |
The order matters. Controls 1 through 3 catch the majority of the leak because they address the two largest root-cause categories (manual data and unreversed refunds). Controls 4 through 6 handle the edge cases that are individually small but collectively material. Control 7 is the last line of defense: a payroll-ready file is not payroll-ready until the reconciliation dashboard has been reviewed and signed off.
The pre-payout reconciliation checklist
Control 7 in the framework above is the one most likely to be skipped and the one that catches problems that survived the others. A pre-payout reconciliation takes 15 to 30 minutes per cycle for a mid-sized team and should include the following eight checks.
- Total payout current period vs prior period, with variance explanation for any change over a defined threshold.
- Payout per rep vs prior three periods, flagging any rep whose payout more than doubles or halves.
- Attainment distribution across the team; a distribution that concentrates above 100 percent when the historical median is 65 percent is a red flag.
- Count and total value of manual adjustments this period, by adjuster.
- Splits that do not sum to exactly the plan-defined total.
- Deals credited to more than one primary owner.
- Reversals: refunds or cancellations that fired but produced no clawback line.
- Reps at or near a plan cap (a common source of “why did my commission stop” underpayment complaints when overpayment prevention overshoots).
Recovering overpayments that have already happened
The controls above prevent future overpayments. Recovering historical ones is legally and operationally harder. In most US states, an employer can recover a demonstrable overpayment from a current employee’s future wages only with the employee’s written authorization or through a documented plan clawback provision. Some states (California, for instance) are especially strict about wage deductions. Recovering from a former employee is typically a civil collections matter and often not worth pursuing for smaller amounts.
Practically, the highest-leverage recovery move is often not recovery at all. It is stopping the ongoing overpayment (fixing the split rule, the plan mapping, or the clawback trigger) and drawing a line under the historical exposure. Consult employment counsel before any post-hoc recovery attempt.
The five-question overpayment audit
- Do we have a single source of truth for every commissionable transaction, or do people still email spreadsheets?
- Are our clawback triggers wired to refund and cancellation events in the billing system, or does someone have to notice manually?
- Do our splits sum to exactly the plan-defined total, enforced by the system?
- Every manual adjustment: does it have an approver, a reason code, and an expiration date?
- Are we running a pre-payout reconciliation with variance flags before each cycle closes?
Answering “no” to any of these questions means overpayments are almost certainly leaking. The Gartner 3 to 5 percent is not a worst case; it is the average.
What to do next
Overpayment prevention is where the business case for commission automation gets built. Every one of the seven controls in the framework above is either built into or auditable in a modern commission platform. If you want to walk through how Sales Cookie enforces splits, handles refunds and cancellations, tracks manual adjustments, pins transactions to plan versions, and produces a pre-payout reconciliation dashboard, book a 30-minute demo and bring last quarter’s numbers.
Related reading
- Retroactive corrections and true-ups
- Manager override workflow
- Inside a crediting engine
- The huge ROI of commission software
- The complete guide to sales commission clawbacks
- Sales commission disputes: anatomy and prevention
Sources and notes
- Gartner sales compensation research on variable-comp overpayment leakage in the 3 to 5 percent range for companies without strong controls.
- Industry research on sales incentive-management payment inaccuracies (83 percent of companies with payment inaccuracies averaging over 5 percent), referenced on Sales Cookie’s University resource page (salescookie.com/University).
- Sales Cookie research: 86-professional survey reporting a 4.2 percent overpayment rate, referenced on the Sales Cookie homepage (salescookie.com).
- Raymond Panko, “What We Know About Spreadsheet Errors” on cell-level error rates in financial spreadsheet models.
- EuSpRIG spreadsheet horror stories.
- General information only; consult employment counsel before attempting post-hoc overpayment recovery in any US state. Statute and enforcement posture current as of June 2026.

