Reading time: about 15 minutes. The pillar reference for FY27 planning: 2026 OTE benchmarks by role and segment, base/variable splits, quota multiples, comp budget as a percent of revenue, attainment distributions, and what is changing this year.
Comp committees, CROs, and CFOs preparing FY27 plans face the same recurring questions. What should our AE OTE look like in our segment? Are we paying competitively in our city? What quota multiple is realistic? How much of our revenue should sales compensation actually consume? This guide consolidates the most reliable benchmark sources for 2026 and notes the meaningful directional changes from 2024 and 2025.
Sources behind the numbers
The benchmarks below blend five public and survey-based data sources, with adjustments where the data is older than 2025:
- WorldatWork Sales Compensation Programs and Practices for plan structure prevalence.
- Bridge Group SaaS AE Metrics & Compensation Research (172 SaaS companies in latest survey).
- Salesforce State of Sales 2024.
- Gartner sales practice benchmark research.
- BLS Operations Research Analyst data for occupational floor reference.
Numbers are rounded to standard ranges and apply to U.S. operations. International operations follow similar structures but with regional pay differences (covered in the geo-differential section).
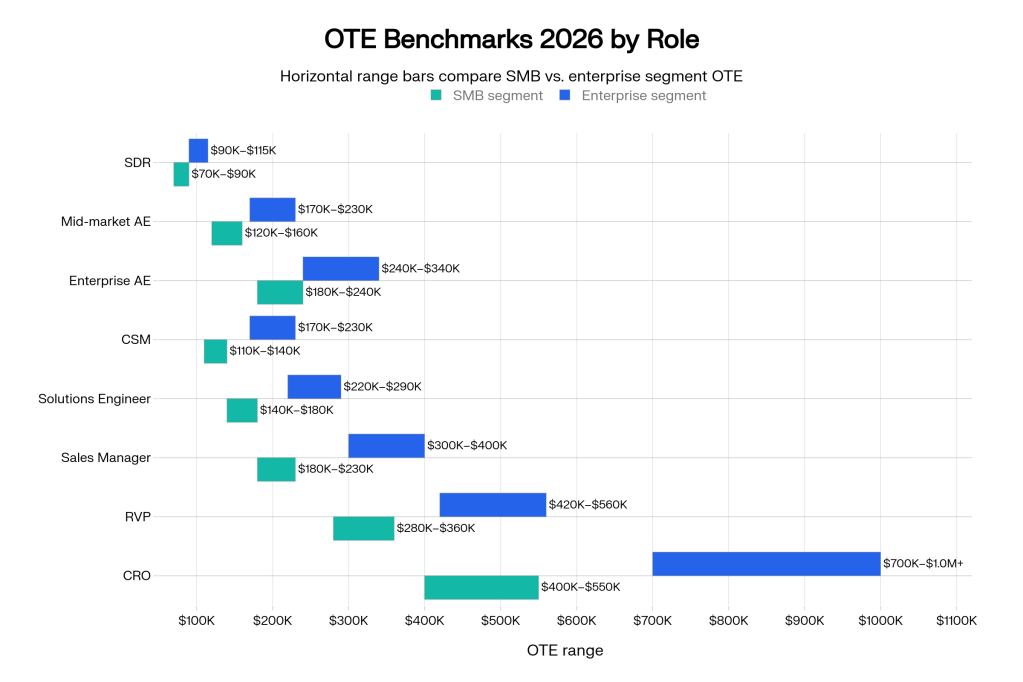
OTE by role and segment
| Role | SMB segment | Mid-market | Enterprise |
|---|---|---|---|
| SDR / BDR | $70K to $90K | $80K to $100K | $90K to $115K |
| Account Executive | $120K to $160K | $170K to $230K | $240K to $340K |
| Sales Engineer / Solutions | $140K to $180K | $180K to $230K | $220K to $290K |
| Customer Success Manager | $110K to $140K | $140K to $180K | $170K to $230K |
| Sales Manager (player-coach) | $180K to $230K | $240K to $310K | $300K to $400K |
| Regional VP Sales | $280K to $360K | $340K to $440K | $420K to $560K |
| CRO | $400K to $550K | $500K to $750K | $700K to $1.0M+ |
OTE figures exclude equity and signing bonuses. Equity is significant in venture-backed startups and modest in mature public companies. The variability within each cell reflects city, company stage, and the particular role’s scope. Mid-market AE compensation moved up roughly 6 to 9 percent from 2024 to 2026, faster than wage inflation generally.
Base/variable splits and quota multiples
| Role | Typical pay mix (base/variable) | Typical quota:OTE multiple |
|---|---|---|
| SDR / BDR | 75 / 25 | N/A (activity-based) |
| SMB AE | 50 / 50 | 4x to 5x |
| Mid-market AE | 50 / 50 | 5x to 6x |
| Enterprise AE | 55 / 45 | 4x to 5x |
| Sales Engineer | 75 / 25 | Pooled / team-based |
| CSM (renewal-ownership) | 70 / 30 | 3x to 4x net retention |
| Sales Manager | 60 / 40 | Sum of team quotas |
| Regional VP / CRO | 60 / 40 | Total org quota |
The quota:OTE multiple has been steady since 2022 in the 4 to 6x range for closing AEs in B2B SaaS. Companies that push to 7x or 8x typically see attainment fall below 60 percent and turnover rise above 25 percent. Companies that drop below 4x see comp expense exceed 25 percent of revenue and CFOs intervene.
Comp budget as percent of revenue
| Company stage | Sales comp as % of revenue | Sales comp as % of bookings |
|---|---|---|
| Pre-PMF / early stage | 25% to 40% | Often higher than revenue % |
| Growth ($10M to $50M ARR) | 18% to 25% | 12% to 18% |
| Scale ($50M to $250M ARR) | 12% to 18% | 9% to 14% |
| Mature ($250M to $1B ARR) | 10% to 14% | 7% to 11% |
| Enterprise public co | 8% to 12% | 5% to 9% |
The comp-to-revenue ratio drops with scale because operating leverage kicks in: more of the revenue is renewal-driven and more deals close through brand pull rather than rep effort. Companies whose ratio stays above 18 percent past $50M ARR have a structural sales-efficiency problem, not just a compensation problem.

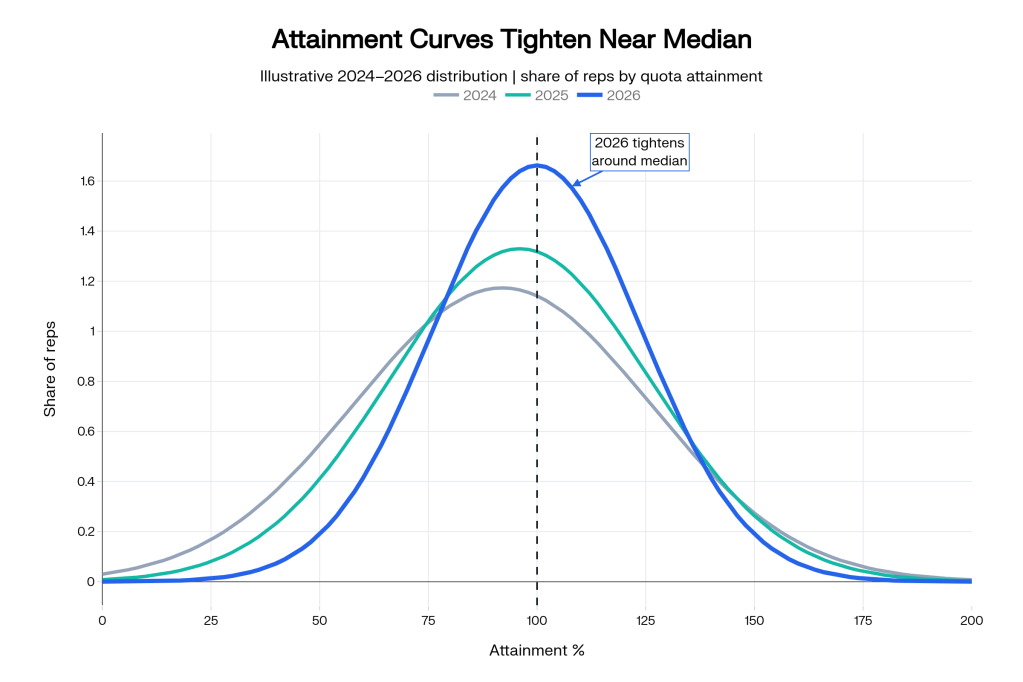
Attainment distribution
The most useful single chart for any CRO and CFO is the team-wide attainment distribution. The 2024 to 2026 directional pattern is consistent across surveys:
| Attainment band | 2024 share of reps | 2025 share | 2026 share (projected) |
|---|---|---|---|
| Below 50% (under-threshold) | 22% | 25% | 23% |
| 50% to 80% | 28% | 30% | 28% |
| 80% to 100% | 22% | 20% | 22% |
| 100% to 120% (on plan) | 14% | 12% | 14% |
| Above 120% (overachievers) | 14% | 13% | 13% |
The healthy distribution puts roughly 60 percent of reps in the 50 to 100 percent band, 15 percent above 100 percent, and 25 percent below 50 percent. Companies where more than half of reps are below 50 percent attainment have either over-set quotas or under-invested in pipeline. Companies where 30 percent or more reps exceed 120 percent attainment have under-set quotas (or have tracked a different metric than the company actually wants).
Geographic differentials
| Metro / Region | OTE multiplier vs. U.S. median | Note |
|---|---|---|
| SF Bay Area | 1.20x to 1.25x | Highest concentration of growth-stage SaaS |
| New York | 1.15x to 1.22x | Strong financial-services and adtech buyers |
| Seattle | 1.12x to 1.18x | Cloud-vendor employer pull |
| Boston | 1.10x to 1.15x | Healthcare and biotech tilt |
| Austin / Denver / Atlanta | 1.00x to 1.05x | Established secondary tech hubs |
| Chicago / Dallas / Phoenix | 0.95x to 1.05x | Mid-market and enterprise selling |
| Remote-US (rest of country) | 0.85x to 0.95x | Anchored to home market in most policies |
The geographic differential narrowed significantly between 2020 and 2023 as remote-first companies leveled pay nationally, then partially widened again in 2024 to 2025 as some employers reverted to anchored zones. The 2026 picture is a mix: about 40 percent of B2B SaaS employers use a single national OTE, 60 percent use 2 to 4 zones.
What is changing in 2026
- Modest variable-comp expansion. Pay mix has shifted incrementally toward variable in mid-market and enterprise AE roles (50/50 to 55/45). Boards favor leverage tied to performance.
- AI-related role compensation. RevOps and Sales Ops talent with AI fluency commands a 5 to 12 percent premium over standard tier benchmarks.
- CSM owned-renewal compensation. More CSMs now have a variable component tied directly to gross revenue retention, replacing pure MBO structures.
- Smaller SPIF programs. Companies running 2 SPIFs per quarter (down from 4 to 5) and integrating them into the comp system rather than running them as side spreadsheets.
- Higher quota:OTE multiples in enterprise. Pressure on enterprise AE quotas continues; the median pushed from 4.5x in 2024 to 4.8x in 2026.
- More aggressive ramp expectations. 6-month ramp dropping to 4.5 months at most companies, paired with stronger onboarding investment.
How to use these benchmarks
The benchmark tables are most useful as a sanity check, not as the answer. The right question is not “what is the median enterprise AE OTE?” but “given our segment, our city, our stage, our motion, and our talent target, where should we be in the range?” Three rules:
- Anchor to your stage and segment. A growth-stage Series C is not the same labor market as a late-stage public co. Use the row that matches your company.
- Pick a quartile target before negotiating. Top-quartile pay attracts top-quartile talent. If your company has decided to compete at the median, accept that the talent funnel will reflect that.
- Reconcile total comp expense to growth plan. If the model says comp will land at 22 percent of revenue when the board has approved 16 percent, the OTE numbers cannot all be right.
The link to plan-design discipline
The benchmarks alone do not produce a good plan. They produce a dollar number. The plan is the structure that converts the dollar number into the right rep behaviors. Companies that benchmark well and structure poorly end up paying competitively for the wrong outcomes. The companies that benchmark well and structure well, with a 60-day rollout (see our rollout playbook) and a written plan document signed by every rep, get full benchmark-driven leverage.
Bottom line
Sales compensation in 2026 looks healthier than 2024, with steady quota multiples, modest variable expansion, and a more rational geographic differential. The data is available, and the boards have access to it too. CROs and Sales Ops leaders preparing FY27 plans should expect to defend their numbers against these benchmarks. The good news is the benchmarks reward thoughtful design.
Run your plan modeling against these benchmarks. Sales Cookie includes a benchmarking dashboard and modeling tools to compare your plan to industry distributions. Pair this guide with our commission structures piece, our rollout playbook, and our commission glossary.
Sources: WorldatWork Sales Compensation Programs and Practices; Bridge Group SaaS AE Metrics & Compensation Research; Salesforce State of Sales 2024; Gartner sales research; BLS OES 15-2031.
