Reading time: about 14 minutes. The total cost of ownership comparison between commission spreadsheets and commission software, written for the Sales Ops or Finance leader still on the fence.
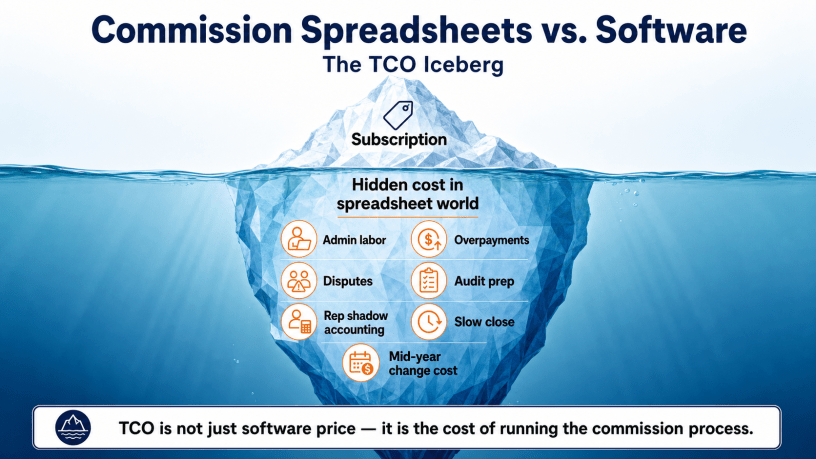
Spreadsheets are the most popular sales commission platform in the world. They are also, by every measurable dimension, the worst one. The reason both statements are true is that the cost of running commissions in a spreadsheet is mostly invisible until something breaks: an audit, a mid-year plan change, a rep who notices a $4,200 mismatch, a board meeting where the comp expense number does not match what payroll paid. The visible cost of a spreadsheet is zero. The invisible cost is six-figure annual.
This is the side-by-side comparison: TCO, error rates, scaling break-points, and the specific failure modes that turn a working spreadsheet into a broken one. The math will look familiar to anyone who has tried to defend a comp-software purchase, because the numbers always come out the same way.
The TCO comparison, side by side
| Cost line | Spreadsheets | Commission software | Notes |
|---|---|---|---|
| Software license | $0 (already have Excel) | Annual subscription | The only line where spreadsheets win. |
| Implementation labor | $0 (or many hours rebuilding each year) | 60-90 days, $20K-$60K typical | One-time vs. recurring spreadsheet rebuild. |
| Ongoing admin labor | ~23 hr/admin/month | ~5-7 hr/admin/month | Sales Cookie benchmark. |
| Overpayment rate | ~4.2% of payouts | ~0.5-1% typical | Material on any comp expense > $1M. |
| Spreadsheet error rate (Panko / EuSpRIG) | 80%+ of non-trivial spreadsheets contain at least one error | Engine-tested; far lower | Decades of research, not vendor marketing. |
| Disputes per 100 statements | High; trust deficit drives volume | Lower; dashboards reduce shadow accounting | Trust is the multiplier. |
| Rep shadow accounting | 62% of reps do it | Drops as dashboards mature | Selling hours recovered. |
| Audit defensibility | Low; no immutable log, no version snapshots | High; per-change log, snapshots, role separation | SOX / ASC 606 implications. |
| Mid-year plan change cost | 1-3 weeks rebuild | 1-3 days reconfiguration | Speed enables better plan decisions. |
| Book close attribution | +2-4 days from commissions | Same-day after final period | Frees finance bandwidth. |
| Key-person risk | Concentrated; one analyst leaves, the model is fragile | Distributed; logic is in a documented engine | Continuity insurance. |
Why spreadsheets fail at scale
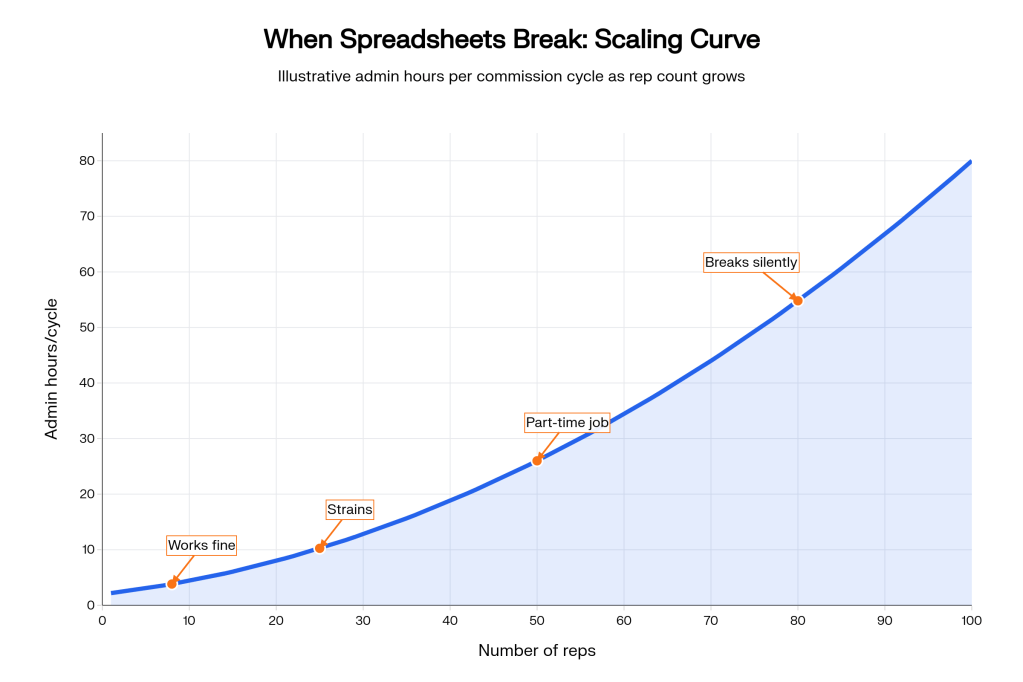
The honest version of the spreadsheet story: they work fine at 5 reps, 1 plan, 1 data source, no audit. They start straining at 25 reps and multiple plans. They become a part-time job for the admin around 50 reps. They break – meaning they produce silently wrong numbers – around 75 reps with mid-year plan changes, or sooner if the company is preparing for a SOX audit.
The five structural reasons:
- Formulas live in cells, not in code. A copy-paste error in row 247 is invisible until the rep finds it. Engine-based systems separate logic from data, so a rule applied to one rep is applied to all.
- No native concept of time-dependent variables. Quotas, rates, and OTE change every quarter. Spreadsheets handle this with new tabs, new files, and naming conventions that survive only as long as the analyst.
- No version snapshot. Last March’s spreadsheet has been edited 4,000 times. The version that ran the March payroll cannot be reconstructed.
- No multi-source data model. CRM data, billing data, and HRIS data have to be flattened into one spreadsheet, with the original field names lost. Cross-lookups become VLOOKUP chains that break the first time someone reorders columns.
- No audit log. If a manual adjustment changes a rep’s commission by $3,000, the spreadsheet has no way of knowing who did it, when, or with what justification.
The error research, in plain terms
The most cited body of work on spreadsheet errors is Ray Panko’s research at the University of Hawaii, plus the catalog maintained by the European Spreadsheet Risks Interest Group (EuSpRIG). Multiple studies measure quantitative error rates in non-trivial spreadsheets and consistently find that the proportion containing at least one material error is above 80 percent. The errors persist because the medium – cell formulas, manual data entry, copy-paste, ad-hoc named ranges – is fundamentally not designed for repeatable financial calculation.
If your commission spreadsheet has more than 100 formulas, more than 3 tabs, or more than one analyst editing it, the probability that it contains a quantitative error in production is high. This is not because your analyst is careless; it is because the platform is the wrong tool. The same analyst running the same logic in a structured engine has dramatically fewer errors.
Scaling break-points
| Team size | Plan complexity | Spreadsheet viability | What forces the switch |
|---|---|---|---|
| 1-10 reps | 1-2 simple plans | OK | Usually nothing yet, but every new hire moves the needle. |
| 10-25 reps | 2-4 plans, some splits | Strained | First multi-tab reconciliation pain. |
| 25-50 reps | 3-6 plans, mid-year changes | Marginal | Disputes per cycle hit double digits; CRO complaints start. |
| 50-100 reps | 5-10 plans, multi-currency starts | Failing silently | Overpayments noticed; first formal audit finding. |
| 100-250 reps | 10+ plans, splits, overlays, channel | Untenable | Sales Ops headcount doubles to keep up; finance close slips. |
| 250+ reps | Multi-segment, multi-entity | No | Auditor cannot sign off on the comp expense line. |
The hidden costs people forget
Beyond the line-item table at the top, three structural costs of spreadsheets get under-counted in most ROI analyses.
Key-person risk. The analyst who maintains the spreadsheet becomes irreplaceable. When they take vacation, no payroll runs. When they leave, the model takes months to reconstruct. This is a real continuity risk and a frequent reason CFOs eventually fund automation.
Plan rigidity. The cost of changing the plan goes up with the spreadsheet’s complexity. A team that knows it will take 3 weeks to rebuild the model after a mid-year accelerator change will not propose the change in the first place, even if the change is the right call for the business. Software lowers the cost of plan iteration, which means better plans get tried.
Reputation cost. Late, wrong, or disputed paychecks are remembered. Reps tell their peers. Recruiting suffers. New hires negotiate harder. The cumulative reputational cost of a bad comp operation is small in any given month, large over years.
When to stay on spreadsheets
To be fair: there are conditions under which staying on a spreadsheet is defensible.
- Fewer than 10 reps, 1-2 simple plans, no audit obligations, no plan changes mid-year, no overlay or split logic.
- An imminent acquisition or shutdown that makes any 60-day implementation pointless.
- A genuine 60-day window in which Sales Ops cannot dedicate any time to migration.
Outside those narrow cases, the spreadsheet is the more expensive option. The cost just lives in different cells of the budget.
Bottom line
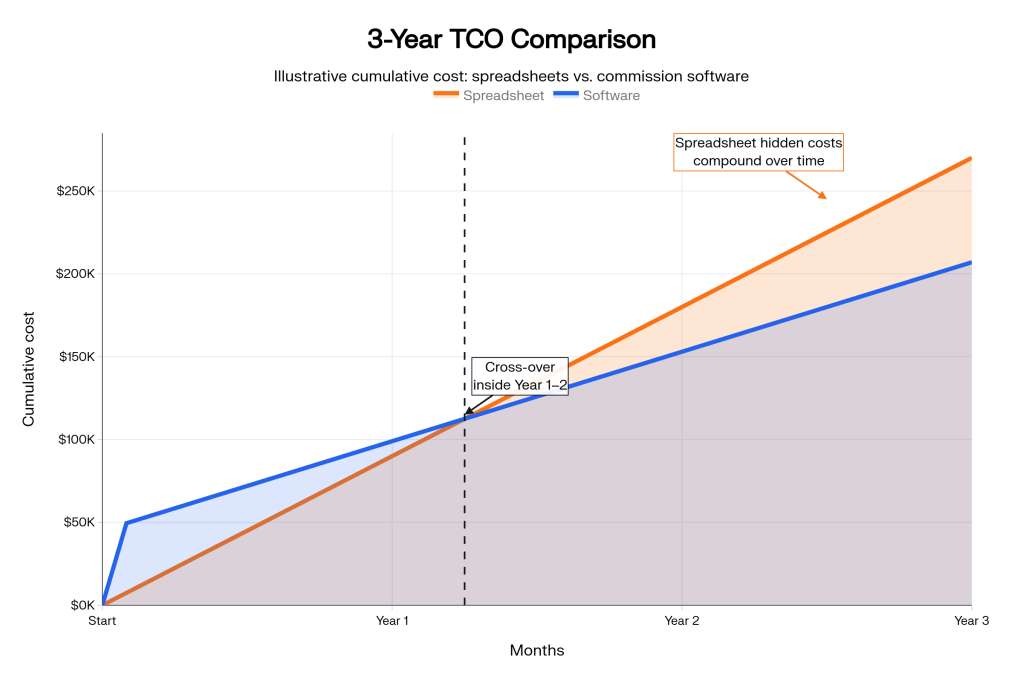
Commission spreadsheets are the most expensive software your company is not paying for. The line items – admin labor, overpayments, dispute resolution, audit prep, shadow accounting, slow close, plan rigidity – add up to a six-figure annual cost that is hidden because no invoice arrives. Replacing the spreadsheet does not save labor; it reallocates it from reconciliation to analysis. The TCO math is consistent across team sizes from 20 to 2,500 reps: by year one, software is cheaper. By year three, it is dramatically cheaper.
Run the TCO yourself. Plug your numbers into the table above. If the spreadsheet wins, stay on it. If it does not, Sales Cookie can show you a working alternative in a 30-minute demo. Pair this article with our why-automate ROI breakdown, our Excel migration playbook, and our commission nightmares roundup.
Sources: Sales Cookie homepage benchmarks; Panko on spreadsheet errors (arXiv); EuSpRIG horror stories; FASB ASC 340-40; BLS OES Sales Ops compensation.

