Reading time: about 15 minutes. The ROI case for automating sales commissions, written for the CFO, VP Finance, or Sales Ops lead who has to defend the budget line.
The question “should we automate sales commissions” is rarely a technology question. It is a math question dressed up as a technology question. On one side of the math is the all-in cost of running commissions on spreadsheets and pivot-tables: hours of administration, percentage of payouts that turn out to be wrong, dispute volume and the time it takes to close each one, the audit risk premium, the rep attention bled into shadow accounting, and the implicit interest charge on a longer book-close. On the other side is the price of a SaaS subscription and a one-time implementation cost. In practically every Sales Ops and Finance organization above 20 reps, the math is not close.
This article walks through the full cost stack of manual commissions, the cost stack of automation, and the realistic payback period. Numbers cited as Sales Cookie homepage benchmarks come from an explicit interview with 86 North American SMB sales management professionals. Numbers cited as broader research come from labor-statistics sources, spreadsheet-error research, and analyst frameworks.
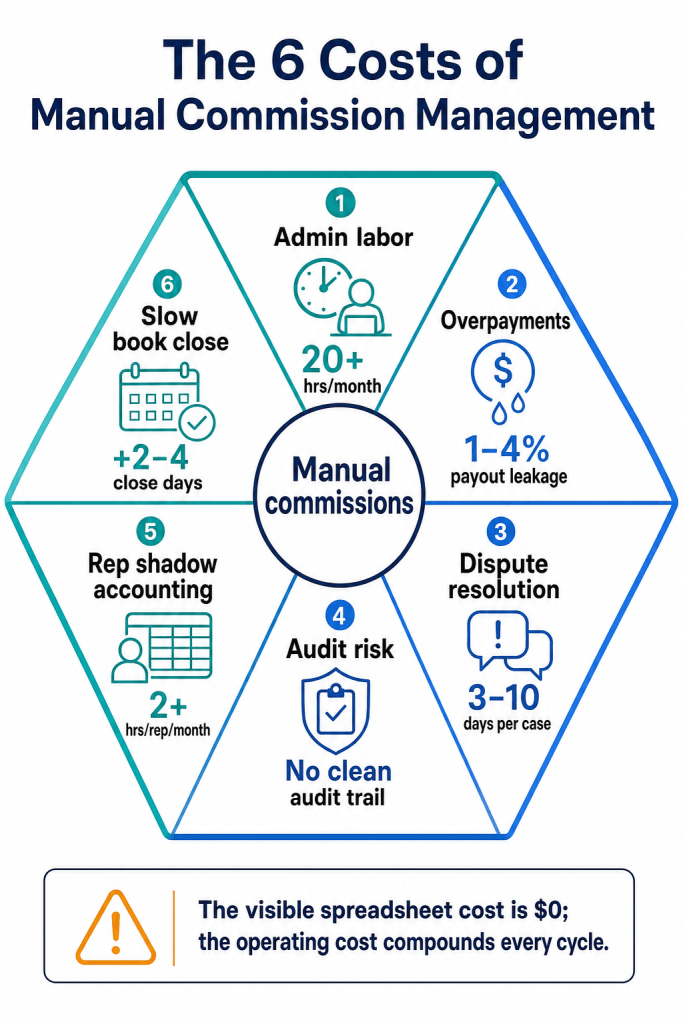
The six hidden costs of running commissions manually
1. Administrative labor
Sales Cookie’s homepage benchmark from its 86-interview survey puts administrative time at 23 hours per month spent on repetitive commission tasks. That is roughly 3 working days per month per administrator, or about 13 percent of a full-time equivalent. For a Sales Ops Specialist whose 2026 BLS-anchored fully loaded cost is in the $95,000 to $115,000 range, that is between $12,000 and $15,000 per year per admin spent on tasks a calculator should do.
The kicker: this number scales linearly with payee count and plan complexity. A 50-rep team with 4 plans is doing one set of 23-hour months. A 200-rep team with 12 plans is often doing 4 to 6 times that volume, and the labor is rarely growing 4 to 6 times. So the work moves into nights and weekends and into payday-eve panic.
2. Overpayments and underpayments
Sales Cookie’s same homepage benchmark finds that 4.2 percent of commission payouts are later identified as overpayments. Independent spreadsheet-error research from Ray Panko and EuSpRIG consistently shows that spreadsheets used for any meaningful financial calculation contain errors at much higher rates than people expect: in repeated studies, the proportion of non-trivial spreadsheets with at least one quantitative error has been measured above 80 percent. Apply even a 2 percent net error rate to a $10M annual commission expense and the loss is $200,000 per year.
Overpayments do not get recovered. A rep who has been paid an extra $4,000 in March is unlikely to be told in June, and even more unlikely to repay it. Underpayments do not stay underpaid: reps’ shadow spreadsheets catch them, dispute volume goes up, and the company eventually pays the difference, plus the resolution labor. Both directions are losses.
3. Dispute volume and resolution time
Manual commission environments produce more disputes per 100 statements than automated ones, for a structural reason: the rep cannot see how their number was built, the admin cannot recompute fast enough to answer the rep, and any disagreement has to be reconciled by hand between two spreadsheets. Our deeper write-up on commission dispute anatomy shows the eight root causes; the relevant point here is that every dispute consumes administrator time, manager time, and rep time, and erodes trust.
4. Audit risk and compliance load
For public companies and increasingly for late-stage private companies preparing for IPO, commission expenses are SOX-relevant and ASC 606 / 340-40 affected. Spreadsheets are not auditable: there is no immutable audit log, plan versions are not snapshotted, manual adjustments are not traceable. Audit firms increasingly classify spreadsheet-based commission processes as a material weakness in internal controls, and the labor required to compensate for that classification is real and ongoing.
5. Rep shadow accounting
Sales Cookie’s survey finds 62 percent of reps maintain shadow spreadsheets to verify their own commissions. That is hours per week of selling time that is being spent on accounting work. A single SDR or AE shadow-accounting two hours per week is paying for about 4 percent of their week in reconciliation that should already exist on a dashboard. Multiplied across the team it is hundreds of selling hours per year per region, gone.
6. Slow book close
For finance teams, the commission line item is often one of the last to clear in a monthly close, because it depends on data that has to be reconciled across CRM, billing, payroll, and the commission spreadsheet itself. A 2-day reduction in close time, achieved by automating commissions, has a real operational value: it pulls forward reporting, reduces overtime, and shortens the lag between revenue recognition and actionable metrics.
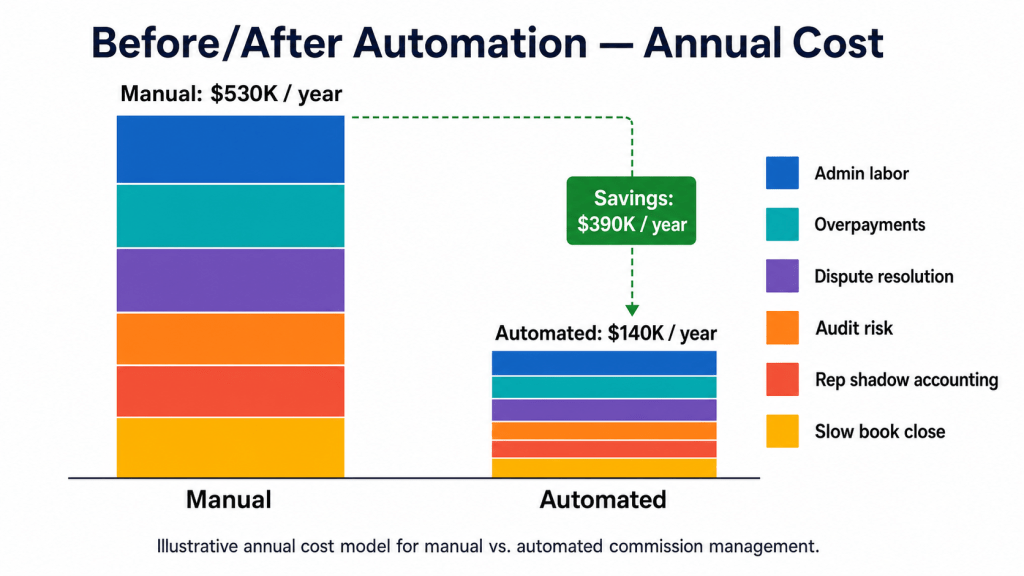
The full cost stack, side by side
| Cost driver | Manual (100 reps) | Automated baseline | Annual delta |
|---|---|---|---|
| Admin labor | 1.0 FTE @ $105K | 0.25 FTE @ $105K | ~$79,000 saved |
| Overpayments | 4.2% of $5M comp = $210K | ~0.8% = $40K | ~$170,000 saved |
| Dispute labor (admin + manager + rep) | ~600 hours/yr | ~250 hours/yr | ~$30,000 saved |
| Audit / compliance prep | ~120 hours/yr | ~40 hours/yr | ~$8,000 saved |
| Rep shadow accounting | 100 reps × 1 hr/wk × $90/hr fully loaded | 100 reps × 0.1 hr/wk | ~$420,000 in selling time recovered |
| Book-close delay | 9-day close | 5-day close | Operational; not in dollar table |
| Software subscription | $0 | ~$36,000 / yr (illustrative) | Net annual savings: ~$671,000 |
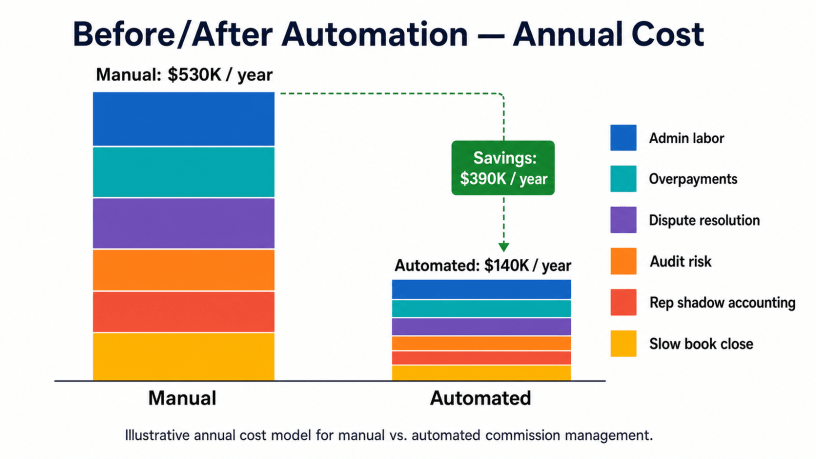
The numbers above are illustrative, not normative. The point is the structure: every commission-software ROI model has the same six saving categories, and software cost is a small line at the bottom relative to the categories above it.
Payback period
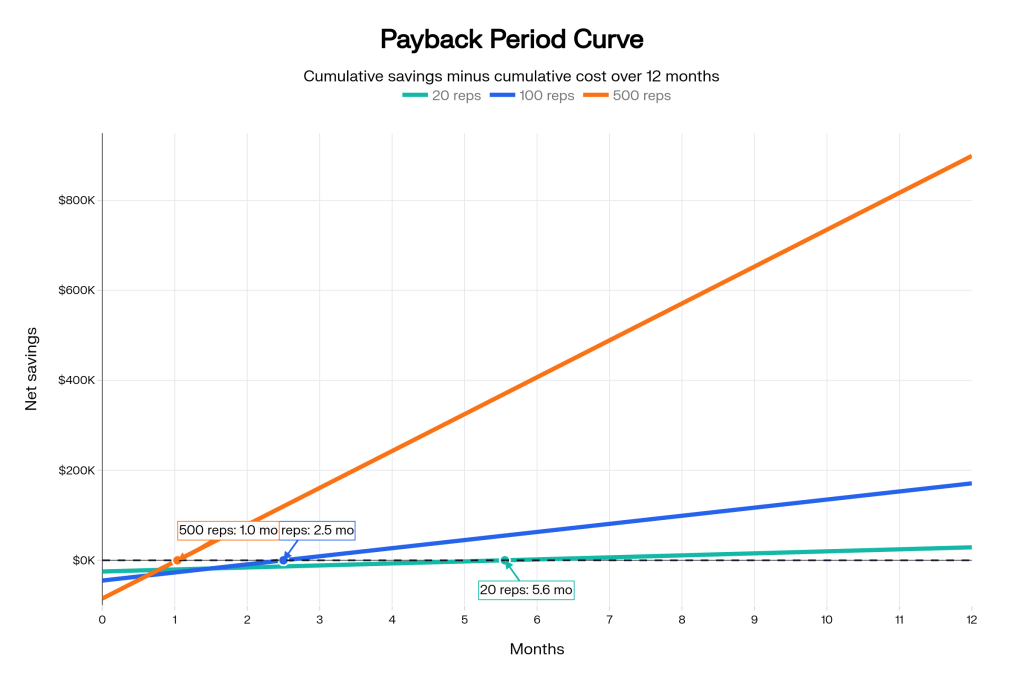
For most teams between 20 and 500 reps, the ROI math results in a payback period of 3 to 8 months. The variables that move this number:
- Reps under management. Linear in the savings categories.
- Comp dollars under management. Linear in the overpayment savings.
- Plan complexity. Drives admin labor and dispute volume; more complexity means a faster payback.
- Public / audit status. SOX environments save more on compliance prep.
- Current dispute volume. A team running 50+ disputes per cycle will see large savings; a team running 5 will see smaller savings.
What gets better that does not show up on the ROI line
Numbers under-represent the operational change. Three things shift quietly:
Plan iteration speed. A mid-year accelerator change that took two weeks now takes an afternoon. The CRO gets used to that and starts making smarter plan calls.
Rep trust. Reps that have line-of-sight on every deal and every accelerator threshold stop quietly distrusting the company. The single biggest source of rep frustration on comp – “I don’t know how this number was built” – just goes away.
Finance optionality. Once commission data is queryable via API, finance can run forecasts, attainment-curve analyses, comp-expense modeling, and SOX evidence packages without asking Sales Ops to export a spreadsheet. The downstream BI value is real.
Common objections, answered
| Objection | Response |
|---|---|
| “Our spreadsheet works fine.” | It works until it doesn’t: one auditor, one mid-year plan change, or one disputed deal makes the case. Spreadsheet error research shows the issue is structural, not effort. |
| “We are too small.” | A team with 10 reps and 2 plans already has the audit, dispute, and overpayment risks. The subscription is small at that size. |
| “We just hired a Sales Ops Analyst.” | That analyst is more valuable doing plan design and analytics than reconciliation. Automation augments, it does not replace. |
| “Implementation will be painful.” | A 90-day parallel-run migration is the standard pattern. We wrote the playbook in our Excel migration guide. |
| “We don’t trust SaaS for comp data.” | Major commission platforms run on hardened cloud infrastructure (Azure, AWS) with SOC 2 certification, role-based access, audit logs, and data residency options. |
| “We can’t justify a long contract.” | Sales Cookie explicitly avoids long-term commitments. There is no reason to sign a 3-year deal for a category that is evolving this fast. |
The ROI worksheet
Plug your own numbers into the structure below and build a one-page ROI for your team:
- Number of payees today: ___
- Annual commission expense: ___
- Number of distinct plans: ___
- Number of admin FTEs touching commissions: ___
- Estimated overpayment rate (start with 2-4 percent): ___
- Disputes per cycle: ___
- Number of cycles per year: ___
- Average rep shadow-accounting hours per week: ___
- Annual audit prep hours on commissions: ___
- Days in monthly close attributable to commissions: ___
Multiply through with realistic fully-loaded labor rates and you will have a defensible ROI in 30 minutes. In our experience, the resulting payback period is typically under 8 months for any team running 20+ reps.
Bottom line
Manual commissions look free because the labor and the errors do not show up on the budget line. Once you put them in a spreadsheet of their own, the choice is no longer between “free” and “$36K of software per year”; it is between roughly $670K of hidden cost and roughly $36K of explicit cost. That decision pays for itself before the second quota cycle. The question stops being “should we automate” and starts being “what platform survives the second year.”
Build your own ROI in 14 days. Sales Cookie’s free trial requires no credit card and supports importing your real data. Pair this ROI breakdown with our buyer’s guide, our spreadsheets-vs-software TCO post, and our Excel migration playbook.
Sources: Sales Cookie homepage benchmarks from interviews with 86 sales management professionals; EuSpRIG spreadsheet error catalog; Panko on spreadsheet errors (arXiv); FASB ASC 340-40; BLS OES Sales Ops compensation.

