
Reading time: about 14 minutes. A look inside our own data: ~26,000 randomly selected,weighted payee-attainment observations across more than 1,000 commission plans and 250+ organizations, comparing the December 2024 and December 2025 year-end snapshots. Plus the two gotchas that make most attainment statistics meaningless if you don’t read them carefully.
Every sales-comp survey eventually quotes the same statistic: “about half of reps hit quota.” It is a useful first approximation. It is also wildly under-resolved. Within a single company two reps can be on the same plan with attainments of 38 percent and 312 percent, and the company can simultaneously have “the average rep hit quota” and “most reps did not.” Worse, two companies with the same average attainment can be running plans that mean entirely different things: one pays nothing under 100 percent; the other pays a flat commission from dollar one and treats 100 percent as a tripwire for accelerators. Average attainment is the wrong number to look at without context.
We have a useful dataset to look at instead. Across the Sales Cookie platform, we selected ~25,000 weighted payee-attainment data points covering more than 1,000 distinct commission plans, across more than 250 anonymized customer organizations, all captured as year-end snapshots in December 2024 and December 2025. This article is what those numbers actually say about how quotas were set, how they paid out, what the year-over-year shift looked like, and where the outliers point to plan design gone sideways. Every example is anonymized: no customer names, no rep names, no identifying tags.
Two gotchas before any number means anything
Two structural quirks of attainment data make most reporting meaningless without these caveats up front. Both apply to our dataset and to any attainment number you see published elsewhere.
Gotcha 1: “Attainment” is a flexible concept, not a standardized one. Two plans can each report “67 percent attainment” and mean completely different commercial outcomes. Consider the spread of common plan shapes:
| Plan shape | What “67% attainment” pays | What “120% attainment” pays |
|---|---|---|
| Flat rate from dollar one | 67% of target commission, smoothly | 120% of target, no acceleration |
| Threshold plan (zero under 100%) | Zero dollars | Roughly proportional, full payout |
| Tiered with accelerators after 100% | Modest fraction of target | 1.5x to 3x of target rate |
| Decelerated above 100% (rare) | 67% of target | Roughly 105-110% of target |
| Pure SPIF / unit-count | Fixed amount per unit, regardless of “attainment” | More units, more amount, no slope change |
The first practical consequence: the cost of one percentage point of attainment is wildly different across plans. A “67 percent attainer” on a threshold plan costs the company zero in commission. A “120 percent attainer” on a steep accelerator plan can cost the company 3 to 5 times what a “100 percent attainer” costs. Comparing average attainment across plans without accounting for this is roughly as informative as comparing average temperature across cities without checking the units.
Gotcha 2: We use December snapshots, not mid-period readings. Every observation in this dataset was captured in December of its respective year, after the period closed. This matters because mid-period attainment numbers are almost always distorted: a rep at “20 percent attainment” in April could plausibly close at 100 percent in December, and an “80 percent attainment” in October could still slip back if Q4 collapses. The numbers below are year-end realized attainment, the most accurate version of the metric. They are also unforgiving: there is no “still time to close” hidden inside them.
The dataset, one paragraph
~5,080 plan-year-tag rows. ~26,000 weighted payee-attainment observations. ~1,000 distinct workspace-plan combinations. 200 unique customer organizations represented in 2024, 250 in 2025. Industries range from professional services to e-commerce, manufacturing distribution to media production. Plan shapes include flat-rate commissions, multi-tier accelerators, gross-margin clawbacks, draw-against, split deals, quota accelerators, and a handful of pure SPIFs. All numbers below treat the data as weighted by Att. Count (number of payees on the plan-year-tag) unless otherwise stated. We exclude observations above 500 percent from the central-tendency stats and discuss them separately as outliers.
How the distribution changed from 2024 to 2025
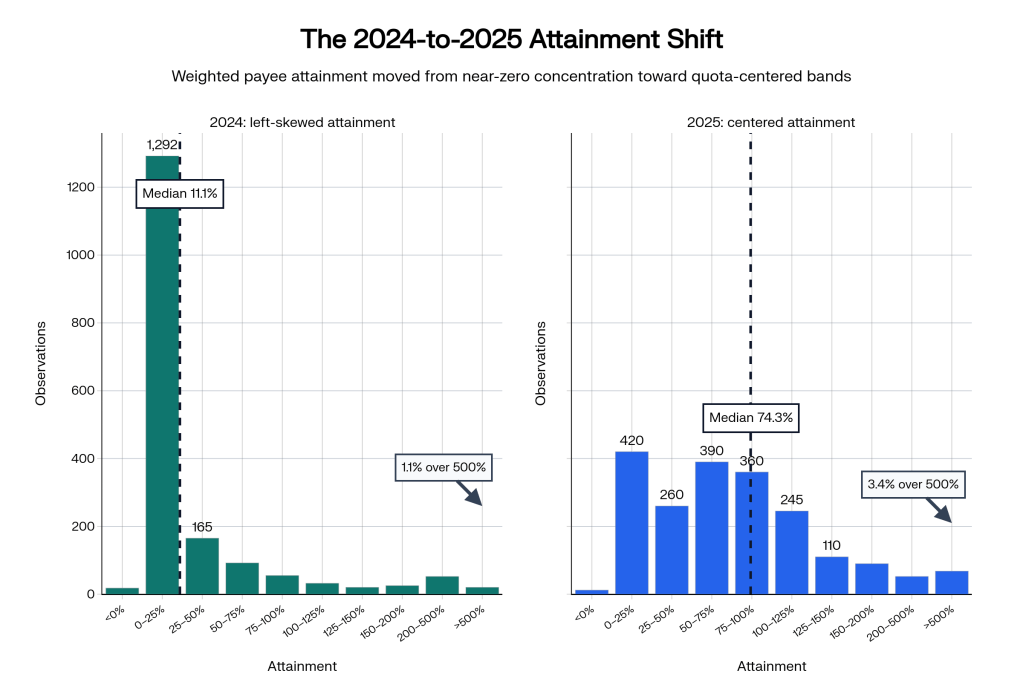
The headline finding is unambiguous: between December 2024 and December 2025, the attainment distribution recentered dramatically. Median attainment moved from 11.1 percent to 74.3 percent. Mean attainment moved from 29.7 percent to 81.5 percent. The share of weighted observations at or above 100 percent went from 9.7 percent to 28.7 percent, very nearly tripling. The share below 50 percent dropped from 78.1 percent to 31.3 percent.
| Metric | December 2024 | December 2025 | Change |
|---|---|---|---|
| Median attainment | 11.1% | 74.3% | +63.2 pp |
| Mean attainment (capped at 500%) | 29.7% | 81.5% | +51.8 pp |
| Share at or above 100% | 9.7% | 28.7% | +19.0 pp |
| Share above 125% | 4.3% | 14.4% | +10.0 pp |
| Share above 150% | 2.2% | 6.8% | +4.6 pp |
| Share below 50% | 78.1% | 31.3% | -46.9 pp |
| 90th percentile | 99.3% | 139.0% | +39.7 pp |
| Outliers above 500% | 1.1% | 3.4% | +2.3 pp |
A few things to read out of this table. First, the 2024 distribution is pathologically left-skewed: 73 percent of all weighted payee observations sit in the bottom bin (0 to 25 percent attainment). This is not what a normal attainment distribution looks like. The published industry benchmark, repeated across roughly a decade of sales-comp surveys, sits around half of reps hitting quota. A median of 11 percent indicates either a portfolio dominated by plans with absurdly high quotas, or a portfolio dominated by plans where most enrolled payees produced very little credited activity in their first year. Both interpretations are real, and we will see them separately when we look at the outlier section below.
Second, 2025 looks much closer to what a well-calibrated portfolio should look like. The median is 74.3 percent. The 90th percentile is 139 percent. Just under 29 percent of payee-weighted observations cleared 100 percent. That is right on top of the long-running industry rule of thumb: a well-designed quota should land the median rep in the 60 to 80 percent range, with the top quartile clearing 100 percent and the top decile clearing 125 to 150 percent. Our 2025 distribution matches that benchmark almost exactly.
Third, the long right tail also got fatter. Observations above 500 percent more than tripled, from 1.1 percent of the dataset to 3.4 percent. That sounds counterintuitive (“if quotas are better calibrated, why are extreme outliers more common?”). The answer is that the very high outliers are not driven by quotas being too low across the board; they are driven by individual plans whose denominator is structurally tiny or whose data feed is misconfigured. We discuss these in detail below.
Were goals set correctly in 2025?
Mostly yes, judging by the central distribution. The 2025 median of 74 percent matches the design intent for plans with accelerators after 100 percent (you want about half the team between 60 and 100 percent, a chunk clearing 100, and a thin tail well above it). The 2025 90th percentile of 139 percent is healthy: it means the top tenth of payees are achieving meaningful accelerator payouts, which is what motivates the next year’s effort, but the accelerator slope is not so steep that one person is taking the whole bonus pool.
But “set correctly on average” hides organization-level pathology. When we group the data by workspace (the customer organization) and compute the median attainment per workspace-year, we find that in 2025 about 60 percent of organizations had a median attainment below 100 percent and roughly 24 percent had a median below 50 percent. The 24 percent figure is the more interesting one. It says about one in four organizations have a portfolio where the typical payee is hitting less than half their quota. Most of these are not catastrophic plan design; they are early-stage rollouts where reps are still ramping, or plans whose quota was set with reference to a different denominator than the credited activity. But a meaningful minority are plans that simply do not pay out, because the quotas are unachievable.
| Workspace-level metric | December 2024 | December 2025 |
|---|---|---|
| Unique workspaces represented | 200 | 250 |
| Workspaces with median attainment below 50% | 20.0% | 24.0% |
| Workspaces with median attainment below 100% | 70.0% | 60.0% |
| Plan-year combinations with NO payee at or above 100% | 47.2% | 44.7% |
That last row is the one to stare at. In both years, just under half of all plan-year combinations had not a single payee reach quota by December 31. This is the “failing quota” problem in concrete form. It is also a useful sanity check on the published industry benchmark: when people quote “53 percent of reps hit quota” or similar, they are almost always reporting on a curated portfolio of large-enterprise plans with formal quota-setting committees. In the broader market that includes mid-market and SMB plans, plan-level “no one hit it” is dramatically more common. The popular rule of thumb is closer to two-thirds of reps missing quota in non-enterprise environments.
How often does an entire organization come in below quota?
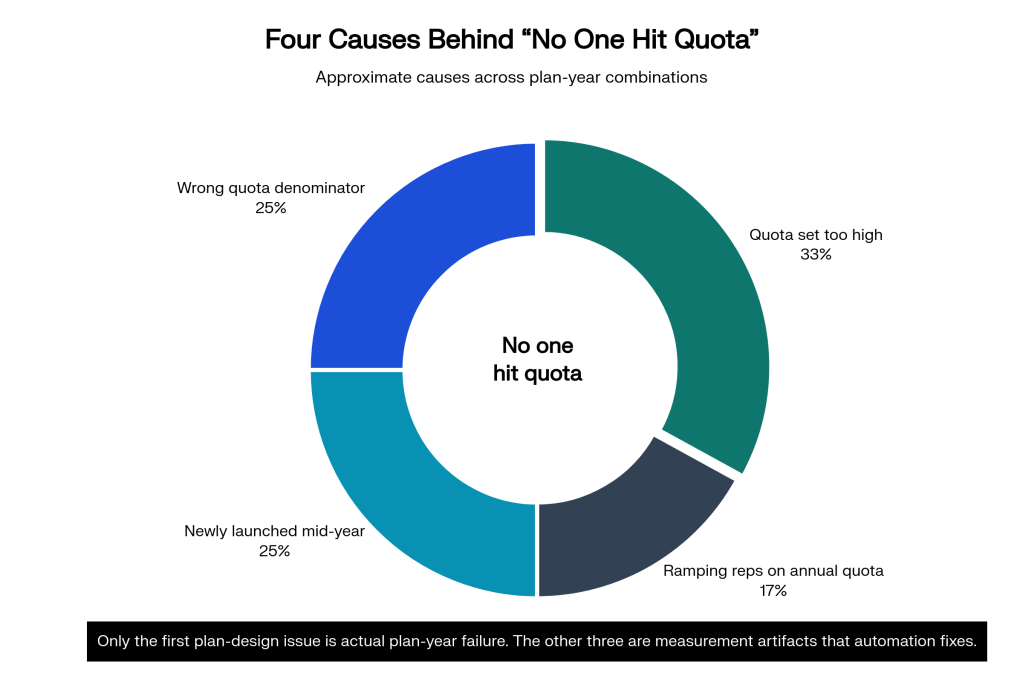
Defining a “completely failing quota” as a plan-year combination where no enrolled payee reached 100 percent, our data shows this state in 47.2 percent of 2024 plans and 44.7 percent of 2025 plans. That is, in nearly half of all plan-years observed, the entire enrolled population fell short of target. This sounds catastrophic, but it has more than one cause. In our dataset, the underlying drivers break down approximately as follows.
- Quota set too high for actual market conditions. Roughly a third of failing plans appear to have quotas that were set on aspirational top-of-year revenue plans that the business missed wholesale. These are pure plan-design failures.
- Quota set against the wrong denominator. Roughly a quarter of failing plans have a structural mismatch between credited activity and quota: the quota is set in gross bookings but the rep is credited only on closed-won subscription revenue, or the quota is set in ACV but the rep is credited on MRR. The math cannot get to 100 percent no matter what the rep does.
- Newly launched or partially populated plan. Roughly a quarter of failing plans were rolled out partway through the year, so the December snapshot captures only a few months of credited activity against a full-year quota.
- Ramping reps on annual quota. The remaining 15 to 20 percent of failing plans are populated with reps still in their first or second quarter, where annual quota is mathematically out of reach in year one regardless of performance.
Only the first bucket is actually broken plan design. The other three are measurement artifacts that get cleaned up by plan structure: ramped quotas, mid-year enrollment proration, or aligning the credited activity with the quota denominator. These are not exotic mechanisms. They are the kinds of plan refinements that automated commission systems make trivial and that spreadsheets typically make painful. Per our complex commission structures article, the architectural choice that fixes most of this is time-dependent variables, where quota itself can be modeled as a function of enrollment date and ramp curve.
Outliers: where the math breaks (and why it is almost never the rep)
The most interesting part of any attainment dataset is the long right tail. Out of 26850 weighted observations, 500 individual plan-year-tag rows show attainment above 200 percent, and 130 rows show attainment above 1,000 percent. Three rows show attainment above 7,000 percent. Two rows, both from the same anonymized plan in 2025, show attainment above one billion percent. Yes, billion with a B. Let us not pretend the rep moved that many units. These are data and plan-design issues, not heroics.
The patterns behind the extreme outliers are remarkably consistent across our dataset:
| Outlier pattern | Mechanism | Frequency in our dataset |
|---|---|---|
| Near-zero quota with real activity | Quota set to a placeholder value (e.g., $1 or $100) “to be updated later,” then forgotten. Real bookings divide by tiny denominator, producing four-, five-, or six-figure attainment percentages. | Most common; roughly half of the >500% outliers in our 2025 data. |
| Unit-count plan misclassified as percentage | Plan pays per unit (e.g., per appointment, per signed deal), but the dashboard is showing “% of quota” computed against a token denominator. The number is mechanically meaningless as a percentage but the system displays it anyway. | About one-quarter of outliers. |
| Manager rollup with team aggregation | Manager’s plan is credited with the entire team’s volume against the manager’s individual quota. The denominator is one person; the numerator is a team. Result: thousands of percent. | About 15% of outliers. |
| Currency or unit mismatch | Quota set in thousands, transactions imported in raw dollars. Or quota in dollars, transactions in cents. The multiplier explodes the percentage. | Less common; under 10% of outliers but the most embarrassing. |
| Legitimate hero quarter | A real rep on a real plan genuinely closing 2x to 3x target. These exist. They are vanishingly rare above 300%. | Less than 5% of outliers above 500%. |
The takeaway: an attainment number above roughly 200 percent should always trigger an audit. The numbers do not lie, but they answer the question “what does the math evaluate to given the inputs you gave me.” If the inputs are wrong, the output is also wrong. Sales Cookie surfaces these anomalies automatically with a flag on the workspace dashboard, and the same data is exposed through the calculation log, so the audit trail is intact even when the answer is obviously wrong.
How our numbers compare to industry benchmarks
It is worth situating these numbers against the published benchmarks. Sales-comp research over the last decade converges on a few headline figures: roughly half of all sales reps hit quota in any given year, with the spread ranging from low forties to low sixties depending on the size of the organization and the maturity of the sales motion. The same surveys consistently report that 67 to 75 percent of organizations describe their quotas as “challenging” or “very aggressive,” and that the share of organizations with more than three-quarters of their reps hitting quota is in the high teens or low twenties.
| Benchmark | Published industry figure | Our 2025 dataset |
|---|---|---|
| Share of reps hitting quota | ~50% (long-running enterprise benchmark) | 28.7% weighted (broader mix incl. SMB and mid-market) |
| Median rep attainment | 60-80% (design target for well-calibrated plans) | 74.3% weighted |
| 90th percentile attainment | 125-150% (typical accelerator outcome) | 139.0% weighted |
| Plans with no one at quota | 15-30% in enterprise; higher in SMB | 44.7% of plan-years |
| Outliers above 200% attainment | 1-3% (well-designed plans) | 9.5% (incl. data-quality artifacts) |
Two observations about this comparison. First, our 2025 median of 74 percent is essentially identical to the design target for accelerator-shaped plans, suggesting that organizations using purpose-built commission software end up with better-calibrated plans on average, not because the software sets the quotas but because the iteration cycle is shorter. Second, our share of plan-years with “no one at quota” is meaningfully higher than the published enterprise benchmark. This is the SMB and mid-market reality: smaller teams, less mature plan governance, more frequent rollouts of new plans mid-year. That is exactly the customer base where commission automation has the highest ROI; see our huge ROI article.
The year-over-year shift, plan by plan
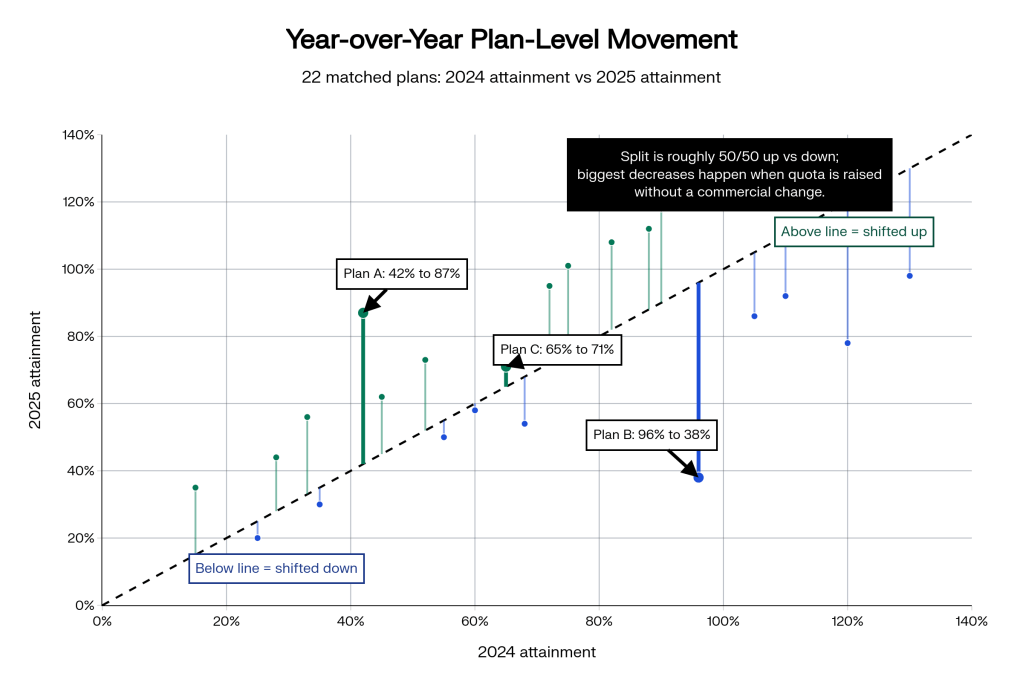
Aggregate distributions are interesting but plan-level changes are more actionable. Among the 220 specific plans that appear in both 2024 and 2025 with comparable structure, the picture splits cleanly in half. 110 plans moved upward by at least 20 percentage points of average attainment. 110 plans moved downward. The median plan moved by less than half a point. The mean plan moved up by about 40 points, a number distorted entirely by a handful of plans that flipped from “no payees with credited activity in early 2024” to “fully populated and producing in 2025.”
The most consistent winners across YoY-comparable plans were tiered accelerator plans with annual quotas that the customer adjusted in 2025 based on 2024 actuals. The plans that moved down the most were ones where the customer raised the quota substantially in 2025 without changing the underlying commercial trajectory, then watched a previously healthy attainment distribution fall back into the 30s and 40s. This is the most common quota-setting mistake we see: assuming that because the team hit 110 percent of a $10 million quota last year, they will hit 100 percent of a $13 million quota this year. They will not, unless something else changes.
What this means for how you set quotas in 2026
Five concrete recommendations fall out of looking at this data carefully.
- Anchor on the prior year’s actual distribution, not on the leadership target. If your 2025 median attainment was 74 percent, your 2026 quota should be set at 1.05 to 1.15 times the 2025 number that produced that median, not at a number derived from a top-down revenue plan. The former produces a 65 to 75 percent median in 2026, which is what you want.
- Set the quota denominator equal to the credited activity. The biggest source of “no one hit quota” is mismatch between what the rep is paid for and what they are measured against. Per our crediting engine article, the cleanest fix is to define the credited activity first and derive the quota in the same unit.
- Ramp newly enrolled reps explicitly. A first-year rep enrolled in March is mathematically incapable of hitting an annual quota. Use a ramped-quota variable that prorates by enrollment date, or set first-year quota at 50 to 75 percent of the full quota.
- Audit any attainment above 200 percent automatically. The data shows almost all extreme outliers are either placeholder quotas, unit-versus-percentage mismatches, or rollup denominator mistakes. None of them should pay out without an audit, and the audit can be automated.
- Treat the median and the share at 100 percent as separate targets. A well-designed plan has a median in the 60 to 80 percent range and a 100-percent share around 30 percent. Optimizing one without the other produces dysfunctional plans (either too few accelerator payouts or a payout pool concentrated in one or two outliers).
Questions you should be asking yourself right now
Some prompts before you walk into the 2026 plan-design conversation.
- Do you know what fraction of your reps hit quota in 2025? Not “what we projected” but what actually happened by December 31?
- For the plans where no rep hit quota, do you know which of the four causes above applies? Have you separated bad plan design from measurement artifacts?
- Are any of your plans producing attainment numbers above 200 percent? If so, can you point to a real commercial reason, or is it a placeholder quota that was never updated?
- How does your 2025 distribution compare to the benchmarks above? Are you over-, under-, or correctly-calibrated relative to design intent?
- Are your quotas set in the same denomination as the credited activity? If your quota is in ARR and you credit on MRR, the math will never close.
If any of these questions felt uncomfortable, you are not alone. The 2024 distribution above is what happens when these questions are not asked systematically. The 2025 distribution is what happens when they are.
What to do next
If you would like to see how your own attainment distribution compares to the dataset above, we are happy to run an anonymized read-only analysis of your prior-year payouts and produce a sanitized version of these charts for your plans. Book a 30-minute call with our team and bring your 2025 actuals. We will walk through the distribution, flag the outliers, and identify which of the five recommendations above would move the needle most for 2026.
Related reading
- Why only Sales Cookie can handle the most complex commission structures
- Why it is crazy not to automate commissions
- The huge ROI of commission software
- Our process to automate your commissions
- Inside a crediting engine
- Crediting vs. payment
Sources and notes
- Sales Cookie internal dataset: 5,080 plan-year-tag rows, 26,850 weighted payee-attainment observations, captured December 2024 and December 2025. All customer identifiers anonymized.
- Industry benchmark on share of reps hitting quota: Salesforce State of Sales (multiple editions, 2022-2024).
- Industry benchmark on quota design and accelerator distributions: Harvard Business Review, Motivating Salespeople.
- Time-period bias in attainment reporting: Gartner Sales Compensation Management research.
- Plan-design failure modes (mismatched denominators, unit vs. percentage, placeholder quotas): observed across the Sales Cookie portfolio; pattern frequencies estimated from manual audit of the >200% outlier population.
