Reading time: about 13 minutes. The seven concrete sources of ROI from commission software, the industry benchmarks behind each, and a worked example you can apply to your own organization.
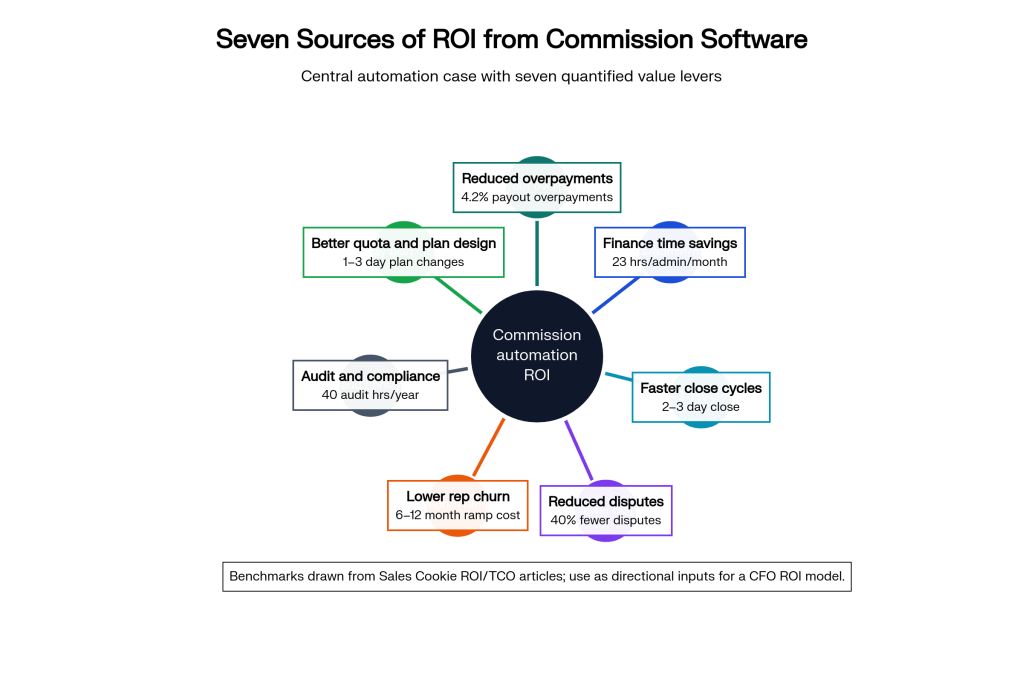
Every commission software vendor publishes an ROI calculator. Most of them are designed to make the answer come out big. The interesting question is not “what does the vendor’s calculator say.” The interesting question is what the independent research and the operational reality of automated commissions actually deliver, and how that maps to the specific numbers in your business. This article walks through the seven concrete sources of ROI, the industry benchmarks behind each, and a worked example for a mid-market SaaS company so you can run the same math on your own.
The headline finding: for most organizations above 25 reps, the ROI of commission automation is not a close call. It is dominated by two or three line items that compound quickly. For organizations above 100 reps, the cost of staying on spreadsheets routinely runs 5x to 20x the cost of automating. The point of this article is not to convince you of that conclusion, but to give you the inputs to verify it yourself with your own numbers.
Source 1: Reduced overpayments
This is the most-cited and most-quantifiable source of ROI. Manual commission processes consistently overpay by a small but persistent percentage of total commission spend. The overpayment comes from a mix of arithmetic errors, missed clawbacks on canceled deals, double-counting on split deals, mid-period quota changes not flowing through, and rep-favorable interpretation of ambiguous rules. Industry surveys cited by major analysts consistently put the overpayment leakage in the 1 to 3 percent range, with automation reducing it to under 0.5 percent.
The math is mechanical. Commission spend times the leakage delta is the annual savings. For a company spending $10 million per year on commissions, 2 percent leakage reduction is $200,000 per year, every year, into perpetuity. For a company spending $1 million, it is $20,000 per year. This is the number where commission software pays for itself by itself; everything else on this list is incremental.
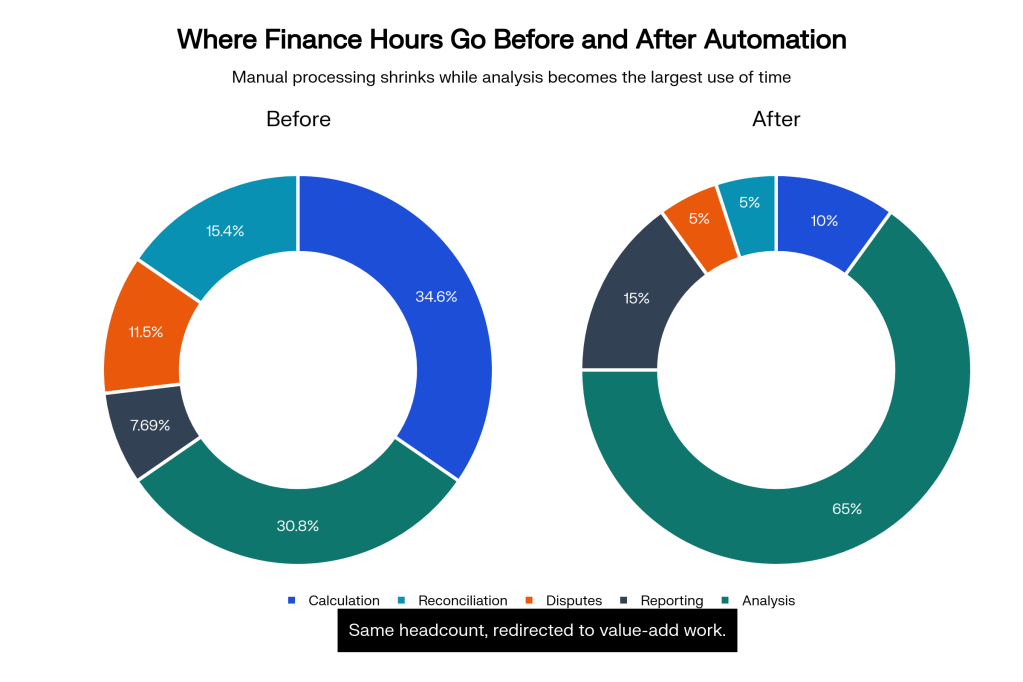
Source 2: Finance team time savings
The second most-visible saving is finance team hours. Manual commissions consume more time than most CFOs realize because the hours are scattered across multiple people: a sales-ops lead doing the calculation, a finance manager reviewing it, a controller approving it, an accounting clerk posting the journal entry. Add a junior analyst supporting all three. Together this typically consumes 10 to 25 percent of one or two full-time positions across a commission cycle.
Per Gartner research on compensation management, automating manual processes like salary planning, merit increases, and compliance reporting can reduce HR administrative hours by up to 40 percent compared to spreadsheet-based processes. For commission specifically, the savings are higher because commission calculations are more complex than salary administration. A reasonable benchmark: 50 to 70 percent reduction in finance hours touching commissions, redirected to higher-value analytical work.
Source 3: Faster close cycles
Commission calculation is often a critical-path step in the period close. Manual commissions add 3 to 7 business days to the close cycle for most mid-market companies. Automation typically takes that to under one day, sometimes to hours. The downstream effect is that finance can close the books faster, post journal entries earlier, and produce management reporting sooner.
This is hard to put a dollar value on directly, but it shows up in the strategic credibility of the finance function. CFOs running closes in 5 days have more influence than CFOs running closes in 12 days, because the rest of the business knows the numbers sooner and can act on them. For private companies preparing for IPO, faster close becomes table stakes for due diligence. The commission step often determines whether a 5-day close is possible.
Source 4: Reduced disputes
Industry surveys referenced by major analysts consistently report a 40 percent or greater reduction in commission disputes after automation. The reasons compound: rep dashboards make payouts visible in real time, so questions get answered before they become disputes. Audit trails make legitimate disputes resolvable in minutes rather than days. Calculation consistency eliminates the dispute category that has no good resolution because “the spreadsheet said so.”
Putting a dollar value on this requires estimating the cost per dispute. A typical dispute consumes 1 to 3 hours of sales-ops time, 30 to 60 minutes of finance time, and frequently 15 to 30 minutes of the rep’s manager time. At fully-loaded internal rates, that is $300 to $800 per dispute. Multiply by disputes per quarter to get the annual cost; reduce by 40 percent to get the annual savings. Most mid-market companies recover $20,000 to $80,000 per year on this line item alone.
Source 5: Lower rep churn driven by statement quality
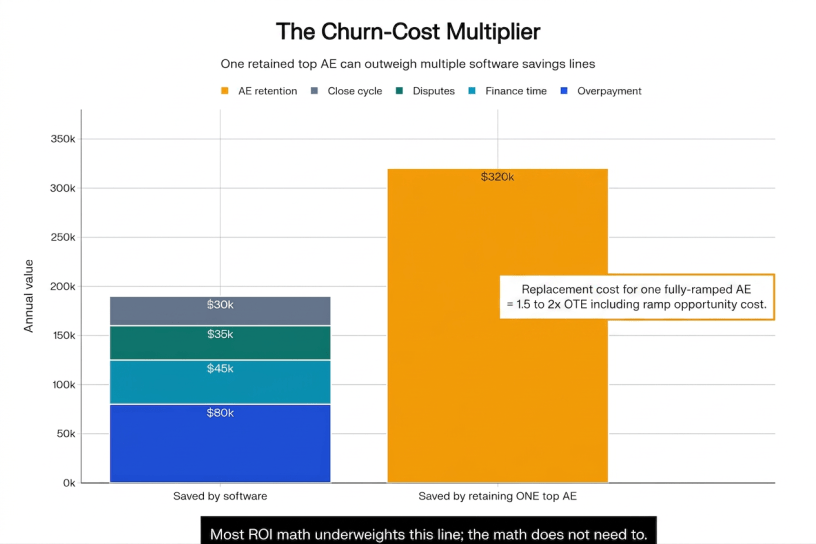
This is the largest single ROI source for many organizations, and the most underweighted. Industry surveys repeatedly find that a measurable percentage of companies lose part of their sales force every year or two specifically because of commission-related trust issues. The departing reps are disproportionately top performers, because top performers have the most to lose from miscalculation and the most outside options.
The cost math is brutal but conservative. Replacing a fully-ramped account executive costs roughly 1.5x to 2x their fully-loaded compensation when you include recruiting, onboarding, ramp opportunity cost, and management time. For an AE earning $150,000 OTE, that is $225,000 to $300,000 per departure. If commission quality has any meaningful influence on top-performer retention, even half a saved departure per year pays for the software many times over.

Source 6: Audit and compliance protection
Two specific exposures get reduced by automation. First, ASC 606 commission capitalization requires tying every payment to the underlying contract and producing an amortization schedule that auditors can reproduce. Manual processes routinely produce audit findings here, and remediation costs typically run $25,000 to $100,000 in advisory fees plus restated periods. Second, state wage-and-hour laws treat earned commissions as wages, and underpayment or unilateral plan changes can trigger penalties, liquidated damages, and attorney-fee shifting. The ability to produce the version of every plan in effect at every transaction date is a meaningful legal defense asset.
Quantifying tail risk is hard. Build in a small annual reserve for audit-finding probability times remediation cost, plus a much larger but lower-probability tail for class-action exposure. For mid-market SaaS companies, a defensible reserve is $10,000 to $30,000 per year; for larger companies the number scales with commission spend. Our six-risks article discusses the legal mechanics in detail.
Source 7: Better quota and plan design
The least-discussed source of ROI is the indirect benefit of having clean commission data available for analysis. When commissions are in spreadsheets, plan design is done by intuition and the previous year’s numbers. When commissions are in a database with an API, plan design becomes evidence-based: which reward bands actually drive behavior, which quotas are achievable, which products are over- or under-incentivized.
Industry research suggests that better incentive alignment delivers a 2 to 5 percent revenue uplift in the affected segments. This is the largest number on the list in absolute terms for revenue-mature companies, but the most variable in outcome because it depends on how seriously the comp design team uses the data. For organizations that take plan design seriously, this can easily be the dominant ROI source. For organizations that treat commissions as a payroll problem, it will not register.
The seven sources, summarized
| Source | Benchmark | Where the dollars come from |
|---|---|---|
| 1. Reduced overpayments | 1 to 2 percent of commission spend recovered | Errors caught, clawbacks applied, splits computed correctly |
| 2. Finance team time savings | 50 to 70 percent fewer hours on commissions | Same headcount redirected to analytical work |
| 3. Faster close cycles | 3 to 7 days off the close | Strategic value to finance; required for IPO readiness |
| 4. Reduced disputes | 40 percent or more fewer disputes | Recovered time across sales-ops, finance, and managers |
| 5. Lower rep churn | Saved AE departures driven by statement quality | 1.5 to 2x OTE per departure avoided |
| 6. Audit and compliance | Audit-finding reserve plus tail-risk reduction | ASC 606 reproducibility; wage-and-hour defense |
| 7. Better plan design | 2 to 5 percent revenue uplift in affected segments | Evidence-based comp design replaces intuition |
A worked example: SaaS company with 75 reps
To make this concrete, here is a representative mid-market SaaS company. The math is intentionally conservative; replace the inputs with your own.
- Company profile: 75 reps total (25 SDR + 40 AE + 10 manager), $6M annual commission spend, $80M ARR, 12-day close cycle.
- Finance team touching commissions: 1 FTE-equivalent across multiple people, fully-loaded $130K/year.
- Disputes per quarter: 25 disputes per quarter, averaging $400 cost each.
- Top-rep churn: 2 AE departures per year, with at least 0.5 attributable to comp quality.
| Source | Calculation | Annual benefit |
|---|---|---|
| Overpayment reduction | $6M x 1.5% | $90,000 |
| Finance time savings | $130K x 60% | $78,000 |
| Dispute reduction | 100 disputes/yr x $400 x 40% | $16,000 |
| Faster close | Strategic; conservative dollar attribution | $20,000 |
| Rep churn avoidance | 0.5 AE departure x $250K replacement | $125,000 |
| Audit and compliance reserve | Annual contingency | $15,000 |
| Plan-design revenue uplift | Conservatively $0 in year 1, scales in year 2+ | $0 |
| Total annual benefit | $344,000 | |
| Commission software cost (year 1) | Subscription + implementation | $30,000 to $60,000 |
Even with the conservative inputs and a $0 contribution from plan-design uplift, the benefit-to-cost ratio is roughly 6x to 11x in the first year. Year 2 onwards drops the implementation cost so the ratio improves further. This is a representative example, not a guaranteed outcome, but the structural arithmetic is consistent across most mid-market companies.
Where the ROI does not show up
Three honest caveats on the math above.
- Small teams under 15 reps often do not clear the ROI hurdle in year 1, because the overpayment savings and finance time savings are too small. The decision becomes about future scale and audit-readiness, not in-year ROI.
- Companies with very simple plans (one rep, one rate, no overrides) see smaller benefits because the error rate is lower and disputes are rare. The case is weaker, though not zero.
- Implementations that fail to actually replace the spreadsheet (parallel maintenance for too long, no decommission decision) capture half the benefit. The biggest ROI killer is “we still maintain the spreadsheet too, just in case.”
How to run this calculation on your own organization
Fill in the four inputs from your own data, apply the benchmarks above, and compare to the commission software annual cost.
- Annual commission spend. Pull from GL. Apply 1 to 2 percent overpayment-reduction benchmark.
- Finance time touching commissions. Estimate FTE-equivalent times fully-loaded cost. Apply 50 to 70 percent savings.
- Disputes per quarter. Count from email archive or ticketing. Apply 40 percent reduction at $300 to $800 per dispute.
- Top-rep departures per year. Honestly assess how many were comp-quality related. Apply $200K to $300K replacement cost per departure.
Add them up. Compare to subscription + first-year implementation. If the multiple is greater than 3x, automation is a strong yes. If 1.5x to 3x, it depends on strategic priorities. If less than 1.5x, run it again in 12 months when the company has scaled.
The bottom line
Commission software ROI is dominated by two or three line items at most companies: overpayment reduction, finance time savings, and rep churn avoidance. Disputes and faster close are real but secondary. Audit and plan design are tail benefits that take a year or more to materialize but become important over time. Most mid-market companies see 5x to 15x first-year ROI on conservative inputs. The biggest predictor of failure to capture the ROI is not the software; it is the willingness to actually retire the spreadsheet.
Run the math, then book a demo. If your numbers say automation is a yes, book a 30-minute call with our team. We will walk through the implementation process for your specific plan, give you a real quote, and tell you honestly when you would break even.
Related reading
- Why it is crazy not to automate commissions
- Our process to automate your commissions
- Why only Sales Cookie can handle the most complex commission structures
- The hidden cost of running commissions manually
- Spreadsheets vs. commission software TCO
Sources
- Sales Cookie, ROI overview
- Gartner research on compensation management automation (industry analyst notes referenced via secondary publications)
- EuSpRIG, Research and Best Practice on spreadsheet error rates
- FASB, ASC 606 / 340-40 incremental costs of obtaining a contract
- Sales Cookie, Deconstructing sales commission software
